Fig. 7
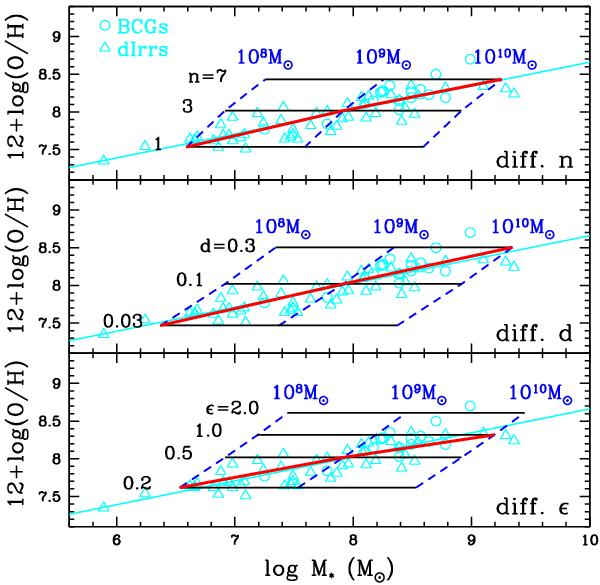
Present-day oxygen abundance vs. M∗ as predicted by models without wind. The upper (middle/lower) panel shows the model results with different numbers of bursts (durations/SFE), along the dashed blue lines the number of bursts (durations/SFE) increases from 2 to 7 (0.02 to 0.3/ 0.1 to 2), and along the solid black lines the total infall mass Minf increases from 108 to 1010 M⊙. The thick solid red line connects the models that are consistent with the observational data, larger n (d/ϵ) for more massive galaxy. The observational data are the same as in Fig. 1, open cyan circles for BCDs and open cyan triangles for dIrrs.
Current usage metrics show cumulative count of Article Views (full-text article views including HTML views, PDF and ePub downloads, according to the available data) and Abstracts Views on Vision4Press platform.
Data correspond to usage on the plateform after 2015. The current usage metrics is available 48-96 hours after online publication and is updated daily on week days.
Initial download of the metrics may take a while.