Fig. 6
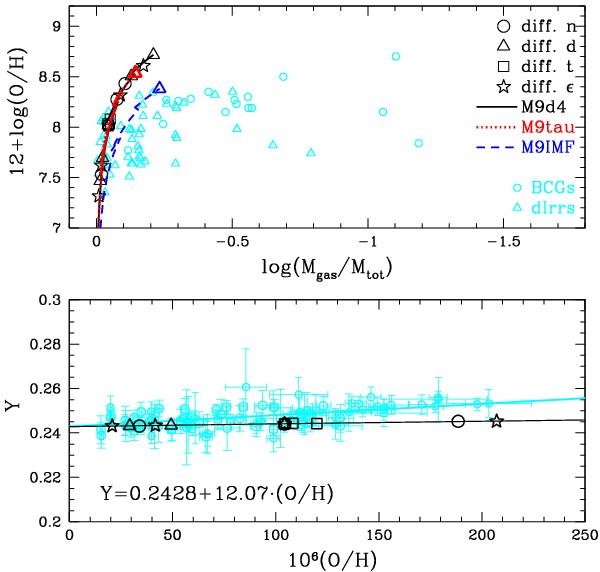
Present oxygen abundance vs. gas fraction (upper panel) and Y vs. oxygen abundance (lower panel) as predicted by models without wind. All these models assume the same total infall mass Minf = 109 M⊙. Big open black circles: models with different numbers of bursts; big open black triangles: models with different durations of bursts; big open black squares: models with different occurrence times of bursts; big open black pentacles: models with different SFE. Solid black, dotted red and dashed blue lines in the upper panel are the evolutionary tracks of model M9d4, M9tau and M9IMF. The solid black line in the lower panel is the best fit of all the model points. The observational data are the same as in Figs. 2 and 4, open cyan circles and open cyan triangles represent BCDs and dIrrs, respectively. The solid cyan line is the best fit of the observational data.
Current usage metrics show cumulative count of Article Views (full-text article views including HTML views, PDF and ePub downloads, according to the available data) and Abstracts Views on Vision4Press platform.
Data correspond to usage on the plateform after 2015. The current usage metrics is available 48-96 hours after online publication and is updated daily on week days.
Initial download of the metrics may take a while.