Fig. 4
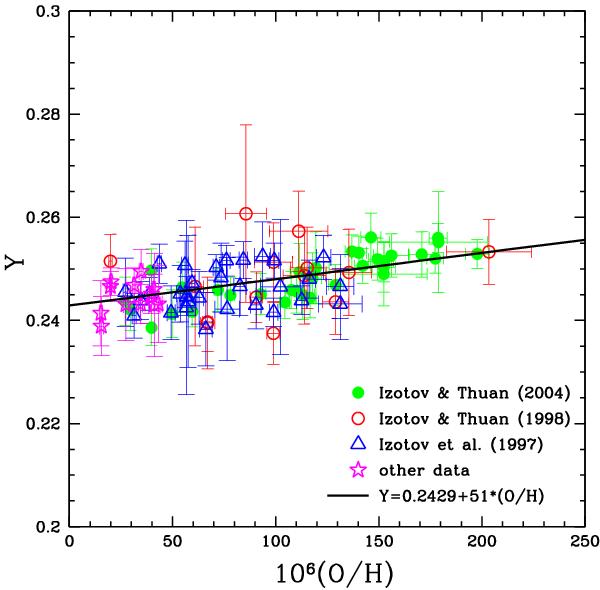
Helium-metallicity (Y − Z) relation for Hii regions in BCDs, Fig. 2 of Izotov & Thuan (2004a). Filled green circles, from Izotov & Thuan (2004a); open red circles, from Izotov & Thuan (1998b); open blue triangles, from Izotov et al. (1997); open magenta pentagrams, from other data (Izotov & Thuan 1998a; Izotov et al. 1999; Thuan et al. 1999; Izotov et al. 2001a,b; Guseva et al. 2001, 2003a,b); the solid line is the maximum likelihood linear regression of all the data, Y = 0.2429 + 43 ∗ (O/H).
Current usage metrics show cumulative count of Article Views (full-text article views including HTML views, PDF and ePub downloads, according to the available data) and Abstracts Views on Vision4Press platform.
Data correspond to usage on the plateform after 2015. The current usage metrics is available 48-96 hours after online publication and is updated daily on week days.
Initial download of the metrics may take a while.