Fig. 2
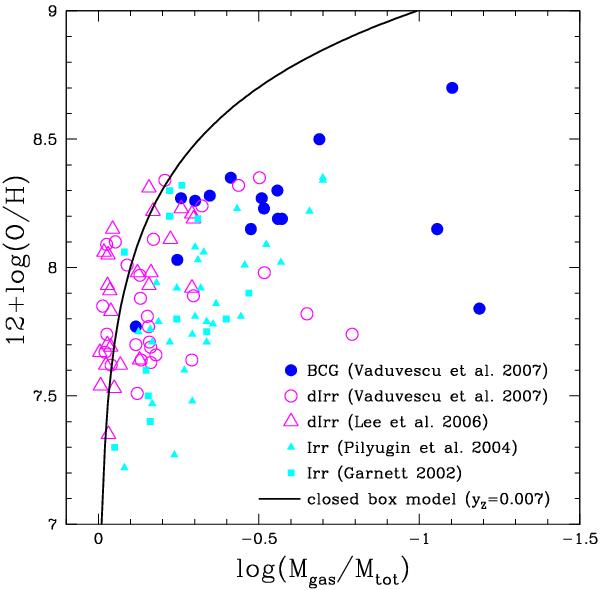
Oxygen abundance vs. gas fraction relation for nearby dIrrs and BCDs. Filled blue and open magenta circles are data from Vaduvescu et al. (2007), and they represent BCDs and dIrrs respectively; open magenta triangles are dIrrs observed by Lee et al. (2006); filled cyan triangles and squares are the Irrs observed by Pilyugin et al. (2004) and Garnett (2002), respectively. The solid line shows the prediction of the closed box model (Z = yZlnμ-1) with an effective yield yZ = 0.007 corresponding to the Salpeter IMF and Woosley & Weaver (1995) nucleosynthesis.
Current usage metrics show cumulative count of Article Views (full-text article views including HTML views, PDF and ePub downloads, according to the available data) and Abstracts Views on Vision4Press platform.
Data correspond to usage on the plateform after 2015. The current usage metrics is available 48-96 hours after online publication and is updated daily on week days.
Initial download of the metrics may take a while.