Fig. 19
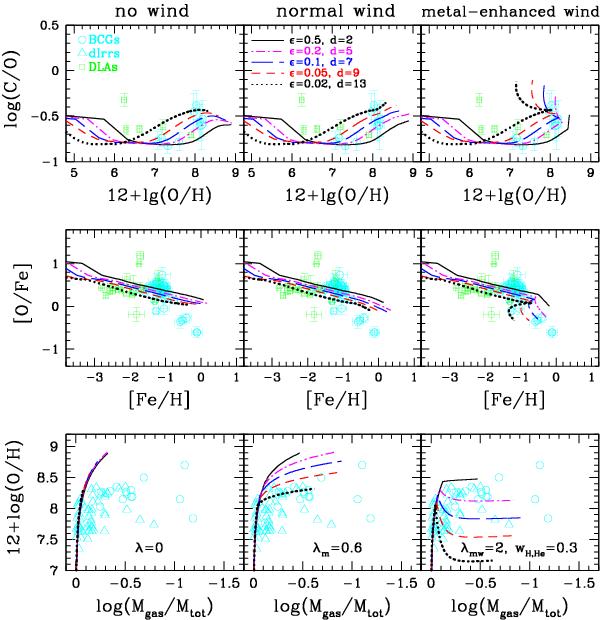
The evolutionary track as predicted by models with continuous SF. From top to bottom, panels show log(C/O) vs. 12 + log(O/H), [O/Fe] vs. [Fe/H], and the μ − Z relation; from left to right columns are for the cases of no wind, normal wind, and metal-enhanced wind (wH, He = 0.3). Models with different SFEs are shown in each case: solid black lines for ϵ = 0.5 (d = 2), dash-dotted magenta lines for ϵ = 0.2 (d = 5), long-dashed blue lines for ϵ = 0.1 (d = 7), dashed red lines for ϵ = 0.05 (d = 9), and dotted black lines for ϵ = 0.02 (d = 13). The total infall masses are assumed to be Minf = 109 M⊙ in all these models. The observational data are the same as in Figs. 2 and 3, BCDs, dIrrs, and DLAs are plotted in open cyan circles, open cyan triangles, and open green squares, respectively.
Current usage metrics show cumulative count of Article Views (full-text article views including HTML views, PDF and ePub downloads, according to the available data) and Abstracts Views on Vision4Press platform.
Data correspond to usage on the plateform after 2015. The current usage metrics is available 48-96 hours after online publication and is updated daily on week days.
Initial download of the metrics may take a while.