Fig. 18
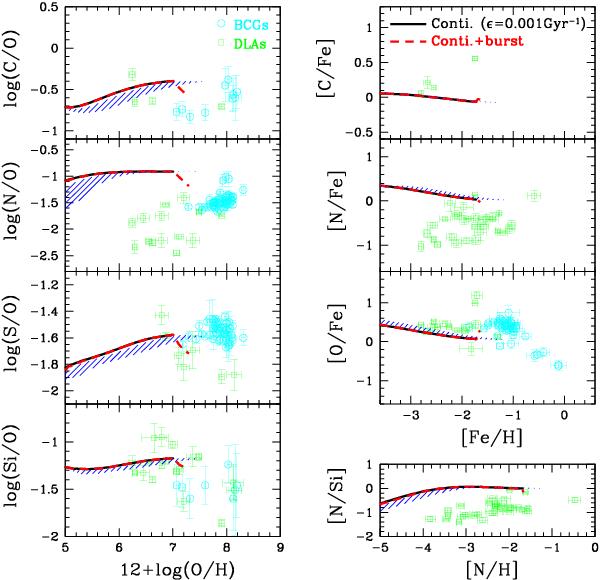
The evolutionary track of abundance ratios as predicted by the models of Legrand (2000). A mild continuous SF with ϵ = 0.001 Gyr-1 is shown by solid black lines, whereas a mild continuous SF (ϵ = 0.001 Gyr-1) combined with a current burst (SFR = 0.023 M⊙ yr-1, i.e., ϵ = 0.88 Gyr-1 if MHI = 2.6 × 10⁷ M⊙, during the last 20 Myr) is shown in dashed red lines. The blue shade areas show the continuous SF with 1.45 × 10⁻³ ≤ ϵ ≤ 3.85 × 10⁻³ Gyr-1 which is derived from the observed SFR and MHI data of IZw 18 (see Table 1 of Legrand 2000). Cyan open circles are BCDs and open green squares are DLAs, as in Fig. 3.
Current usage metrics show cumulative count of Article Views (full-text article views including HTML views, PDF and ePub downloads, according to the available data) and Abstracts Views on Vision4Press platform.
Data correspond to usage on the plateform after 2015. The current usage metrics is available 48-96 hours after online publication and is updated daily on week days.
Initial download of the metrics may take a while.