Fig. 15
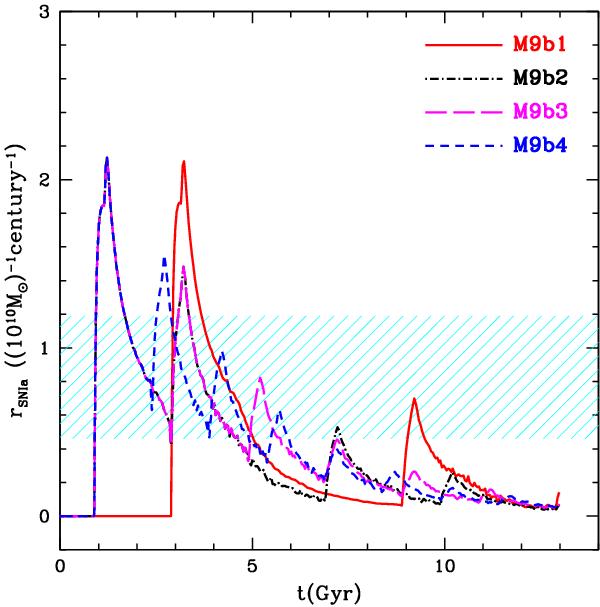
The SN Ia rate normalized to the galaxy stellar mass as a function of time as predicted by our best models (Minf = 109 M⊙). The solid red, dash-dotted black, long-dashed magenta and short-dashed blue lines are for models M9b1, M9b2, M9b3, and M9b4, respectively. As a comparison, the shaded area shows the observed range of normalized SN Ia rate in the Irr galaxies,  per century and per 1010 M⊙ (Mannucci et al. 2005).
Current usage metrics show cumulative count of Article Views (full-text article views including HTML views, PDF and ePub downloads, according to the available data) and Abstracts Views on Vision4Press platform.
Data correspond to usage on the plateform after 2015. The current usage metrics is available 48-96 hours after online publication and is updated daily on week days.
Initial download of the metrics may take a while.