Fig. 12
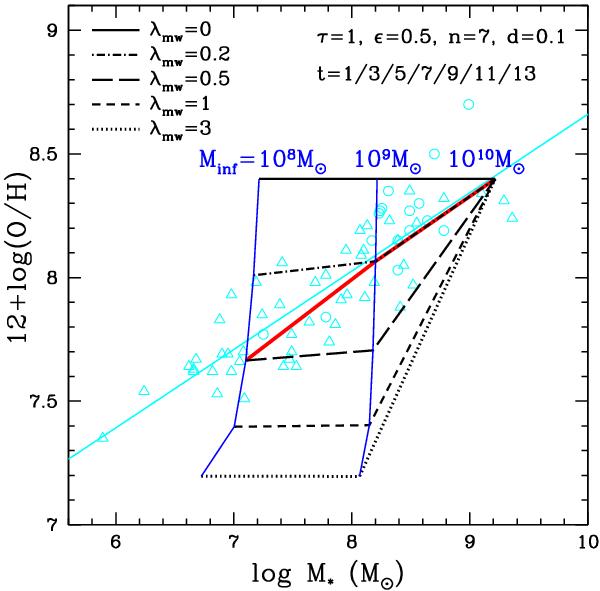
Present-day oxygen abundance vs. M∗ as predicted by models with metal-enhanced wind (wH,He = 0.1). All the models contain 7 bursts and the same SFH (ϵ = 0.2,n = 7,t = 1/3/5/7/9/11/13,d = 0.1 for each burst), and the total infall mass varies from Minf = 108 to 1010 M⊙. The predicted M − Z relation with different strength of metal-enhanced wind are shown by different lines: dash-dotted, long-dashed, short-dashed, and dotted black lines are for λmw = 0,0.2,1,3 respective. Models with the same Minf are connected by blue lines. An increasing wind efficiency to less massive galaxies is shown by a solid red line, which can fit the data very well. Observational data are shown by open cyan circles (BCDs) and open cyan triangles (dIrrs), the solid cyan line is the best fit of all the data, as in Fig. 1.
Current usage metrics show cumulative count of Article Views (full-text article views including HTML views, PDF and ePub downloads, according to the available data) and Abstracts Views on Vision4Press platform.
Data correspond to usage on the plateform after 2015. The current usage metrics is available 48-96 hours after online publication and is updated daily on week days.
Initial download of the metrics may take a while.