Fig. 11
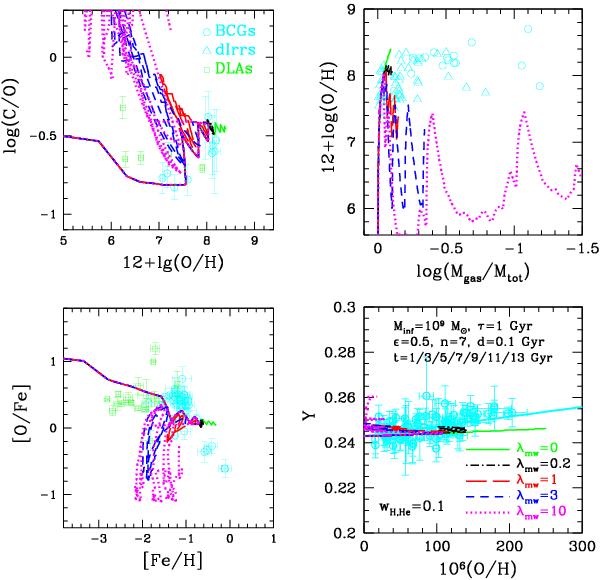
The evolutionary track as predicted by models with various metal-enhanced wind efficiencies. The two left panels are log(C/O) vs. 12 + log(O/H) and [O/Fe] vs. [Fe/H]; the two right panels are oxygen abundance vs. gas fraction and Y vs. (O/H). All 5 models have the same burst sequence (t = 1/3/5/7/9/11/13 Gyr, and d = 0.1 Gyr for each burst), but different wind efficiencies. Solid green lines: λmw = 0; dash-dotted black lines: λmw = 0.2; long-dashed red lines: λmw = 1; short-dashed blue lines: λmw = 3; dotted magenta lines: λmw = 10. All these models assume the same total infall mass Minf = 109 M⊙. The observational data are the same as in Figs. 2–4, BCDs, dIrrs, and DLAs are plotted in open cyan circles, open cyan triangles, and open green squares here.
Current usage metrics show cumulative count of Article Views (full-text article views including HTML views, PDF and ePub downloads, according to the available data) and Abstracts Views on Vision4Press platform.
Data correspond to usage on the plateform after 2015. The current usage metrics is available 48-96 hours after online publication and is updated daily on week days.
Initial download of the metrics may take a while.