Fig. 1
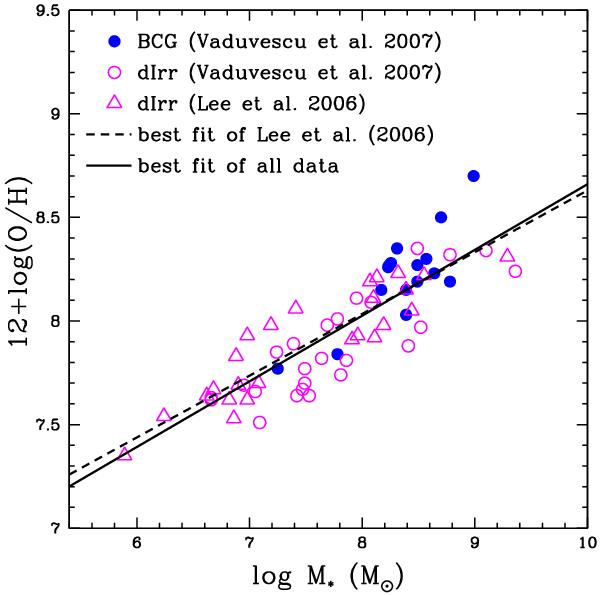
Oxygen abundance vs. stellar mass for nearby dIrrs and BCDs. Filled blue and open magenta circles are data from Vaduvescu et al. (2007), and they represent BCDs and dIrrs, respectively; open magenta triangles are dIrrs observed by Lee et al. (2006), and the dashed line shows the best fit of their data. The solid line is the best linear fit of all the data.
Current usage metrics show cumulative count of Article Views (full-text article views including HTML views, PDF and ePub downloads, according to the available data) and Abstracts Views on Vision4Press platform.
Data correspond to usage on the plateform after 2015. The current usage metrics is available 48-96 hours after online publication and is updated daily on week days.
Initial download of the metrics may take a while.