Fig. 8
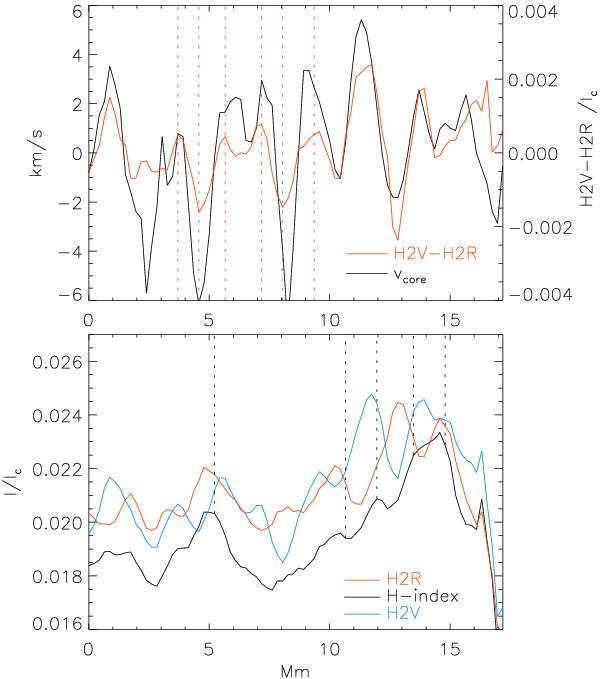
Appearance of the Doppler excursions at 2.5 Mm in intensity and velocity. Top: velocity proxies. Red: difference of H2V and H2R. Black: position of the line core. The blue and red dashed vertical lines denote the locations of blue/red shifts. Bottom: intensity of H2V (blue), H2R (red), and the H-index (black). The vertical black dashed lines indicate local maxima of the H-index. The abscissa is in Mm.
Current usage metrics show cumulative count of Article Views (full-text article views including HTML views, PDF and ePub downloads, according to the available data) and Abstracts Views on Vision4Press platform.
Data correspond to usage on the plateform after 2015. The current usage metrics is available 48-96 hours after online publication and is updated daily on week days.
Initial download of the metrics may take a while.