Fig. 6
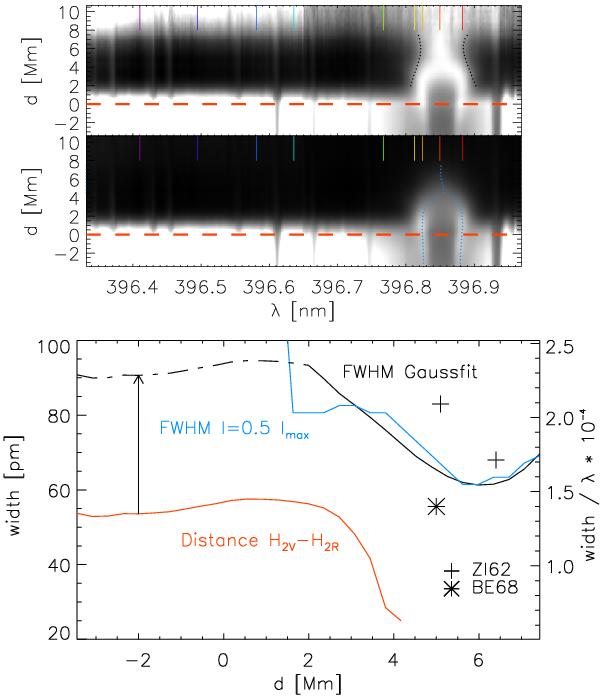
Top: the full average off-limb spectrum normalized row by row; the wavelengths used in the middle panel of Fig. 5 are marked by short vertical lines at the top. Middle panel: the same spectrum without additional normalization. The blue dots indicate the locations of the emission peaks, the black dots the FWHM. The red horizontal dashed lines denote the location of the limb. Bottom panel: FWHM from a fit of a Gaussian (black), from the location of 50% of the maximum intensity (blue), and the distance between the emission peaks (red). Crosses and asterisks mark the values given by ZI62 and BE68, respectively.
Current usage metrics show cumulative count of Article Views (full-text article views including HTML views, PDF and ePub downloads, according to the available data) and Abstracts Views on Vision4Press platform.
Data correspond to usage on the plateform after 2015. The current usage metrics is available 48-96 hours after online publication and is updated daily on week days.
Initial download of the metrics may take a while.