Fig. 5
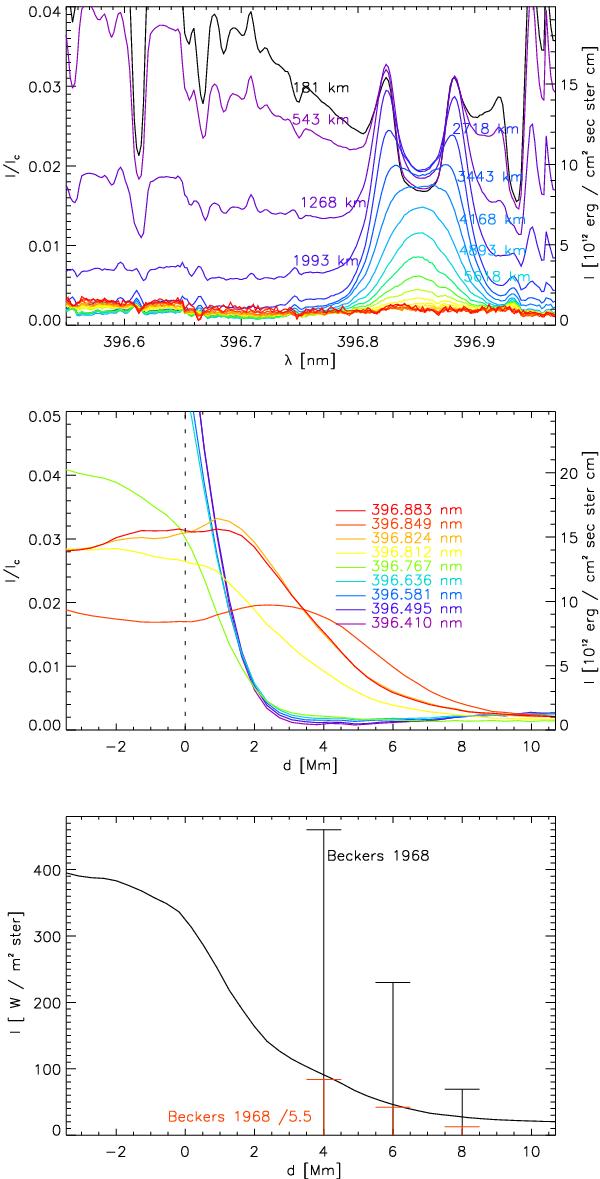
Top panel: average off-limb spectra of Ca ii H with increasing limb distance d. Middle panel: intensity variation with limb distance for the wavelengths marked in Fig. 6. The limb is denoted by a vertical black dashed line. The right scale uses the same units as in Zirker (1962). Bottom: the energy of the radiation integrated over the line-core region. The black vertical bars denote the energy as given by BE68, and after division by a factor of 5.5, respectively (red).
Current usage metrics show cumulative count of Article Views (full-text article views including HTML views, PDF and ePub downloads, according to the available data) and Abstracts Views on Vision4Press platform.
Data correspond to usage on the plateform after 2015. The current usage metrics is available 48-96 hours after online publication and is updated daily on week days.
Initial download of the metrics may take a while.