Fig. 2
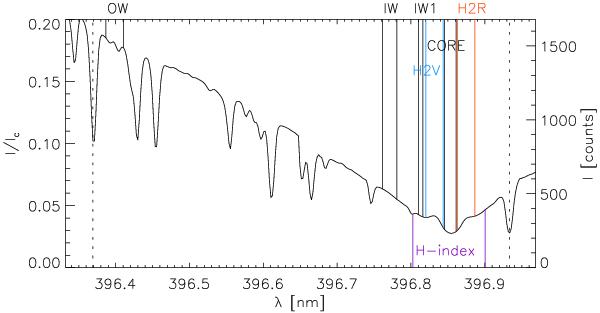
Average Ca spectrum of the observed FOV (on disk). The locations of specific spectral windows are marked by vertical solid lines. The vertical dashed lines denote two blends whose line-core velocity was additionally measured. The left scale gives the intensity relative to the disk-center continuum, the right scale the detector count value before the normalization.
Current usage metrics show cumulative count of Article Views (full-text article views including HTML views, PDF and ePub downloads, according to the available data) and Abstracts Views on Vision4Press platform.
Data correspond to usage on the plateform after 2015. The current usage metrics is available 48-96 hours after online publication and is updated daily on week days.
Initial download of the metrics may take a while.