Free Access
Fig. A.1
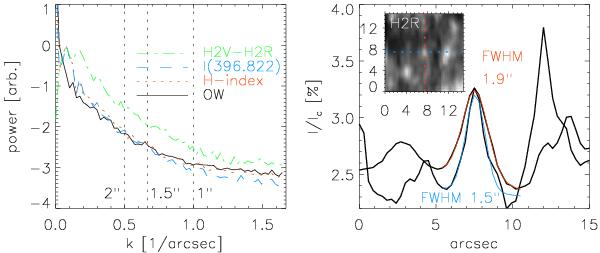
Spatial resolution. Left: Fourier power as function of spatial frequency. Right: vertical and horizontal cuts through the center of the H2R map shown as inset at the upper left. Gaussian fits to the central brightening are overplotted with red and blue lines, respectively.
Current usage metrics show cumulative count of Article Views (full-text article views including HTML views, PDF and ePub downloads, according to the available data) and Abstracts Views on Vision4Press platform.
Data correspond to usage on the plateform after 2015. The current usage metrics is available 48-96 hours after online publication and is updated daily on week days.
Initial download of the metrics may take a while.