Fig. 6
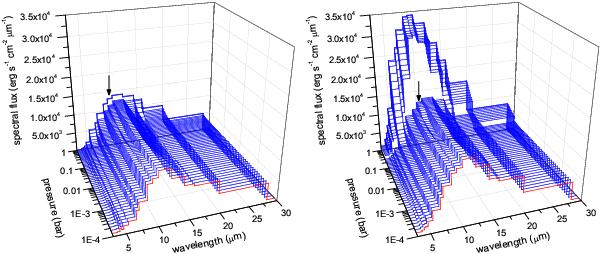
Spectral tomography of the thermal emission spectra from the surface to the top of the atmosphere of an Earth-like planet orbiting the F-type star. Left diagram: 100% single low-level cloud cover (Tsurf = 255.4 K), right diagram: 100% coverage of single high-level clouds (Tsurf = 305.6 K). The position of the ozone band is marked by arrows.
Current usage metrics show cumulative count of Article Views (full-text article views including HTML views, PDF and ePub downloads, according to the available data) and Abstracts Views on Vision4Press platform.
Data correspond to usage on the plateform after 2015. The current usage metrics is available 48-96 hours after online publication and is updated daily on week days.
Initial download of the metrics may take a while.