Fig. 2
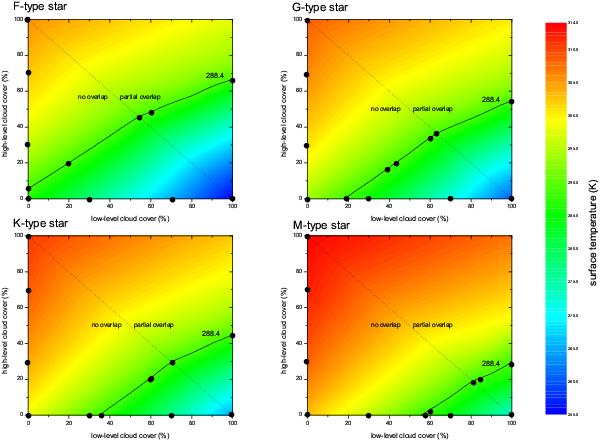
Surface temperatures of planets orbiting four different types of central stars as a function of the coverages of low and high-level clouds (see Paper I for a detailed discussion of these results). The solid lines on the contour plots represent parameters for which a mean Earth surface temperature of 288.4 K is obtained. The dashed lines in the x-y-planes separate the regions between partial cloud overlap and no overlap. Black dots indicate the cloud coverages for which spectra are presented in this study at the relevant surface temperatures.
Current usage metrics show cumulative count of Article Views (full-text article views including HTML views, PDF and ePub downloads, according to the available data) and Abstracts Views on Vision4Press platform.
Data correspond to usage on the plateform after 2015. The current usage metrics is available 48-96 hours after online publication and is updated daily on week days.
Initial download of the metrics may take a while.