Fig. 7
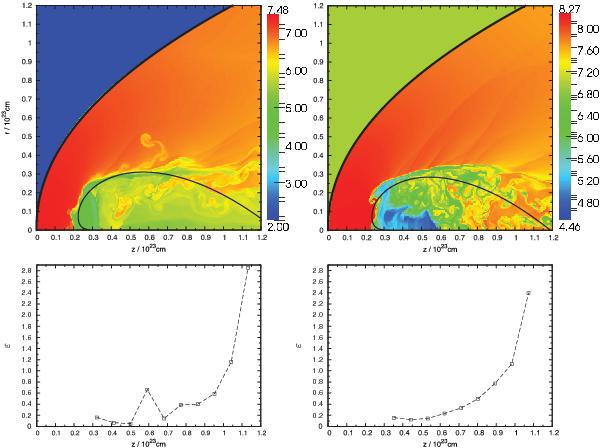
Like Fig. 6. Upper left. Model of the interaction between NGC 7318b and the IGM in SQ at the time t = 200 Myr (j = 0,  ). Upper right. Model of the interaction between an IC 1263-like galaxy and the IGM in the galaxy group around IC 1262 at the time t = 130 Myr (j = 0,
  ). The upstream Mach number here is only M∞ = 5. The lower panels give the corresponding percentage errors.
Current usage metrics show cumulative count of Article Views (full-text article views including HTML views, PDF and ePub downloads, according to the available data) and Abstracts Views on Vision4Press platform.
Data correspond to usage on the plateform after 2015. The current usage metrics is available 48-96 hours after online publication and is updated daily on week days.
Initial download of the metrics may take a while.