Fig. 6
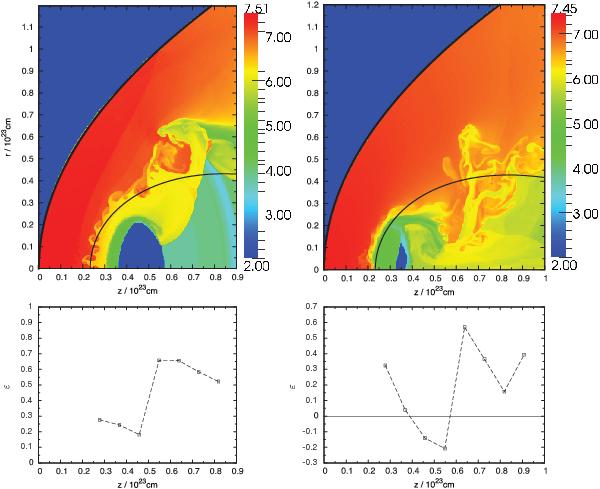
Comparison of numerically (here log temperature in K is colour-coded) and analytically derived results. The thin line represents the outer envelope of the galaxy, whereas the thick line represents the bow shock. Upper left. Model of the interaction between NGC 7318b and the IGM in SQ at the time t = 60 Myr (j = 0,  ). Upper right. Same as upper left, but at at t = 130 Myr (j = 0,
  ). The lower panels give the corresponding percentage errors.
Current usage metrics show cumulative count of Article Views (full-text article views including HTML views, PDF and ePub downloads, according to the available data) and Abstracts Views on Vision4Press platform.
Data correspond to usage on the plateform after 2015. The current usage metrics is available 48-96 hours after online publication and is updated daily on week days.
Initial download of the metrics may take a while.