Fig. 3
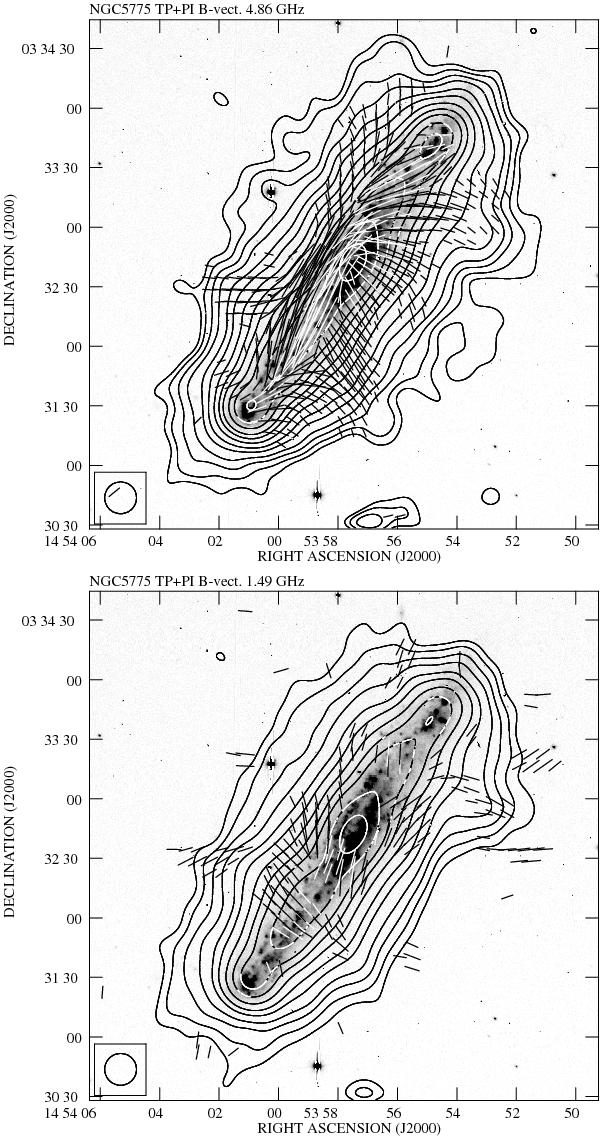
Total intensity contour map with apparent polarization B-vectors at 4.86 GHz (left) and 1.49 GHz (right). Both maps are superimposed on the Hα image (from Tüllmann et al. 2000). Contours are plotted at levels (3, 5, 8, 12, 20, 30, 50, 80, 120, 200, 300 and 500) × 10 and 60 μJy/b.a., respectively (rms levels at corresponding frequencies). Vectors are proportional to the polarized intensity (10″ corresponds to 50 μJy/b.a.) and indicate apparent B-orientation. The resolution is 16″ HPBW in both maps.
Current usage metrics show cumulative count of Article Views (full-text article views including HTML views, PDF and ePub downloads, according to the available data) and Abstracts Views on Vision4Press platform.
Data correspond to usage on the plateform after 2015. The current usage metrics is available 48-96 hours after online publication and is updated daily on week days.
Initial download of the metrics may take a while.