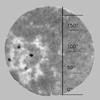
Fig. 5
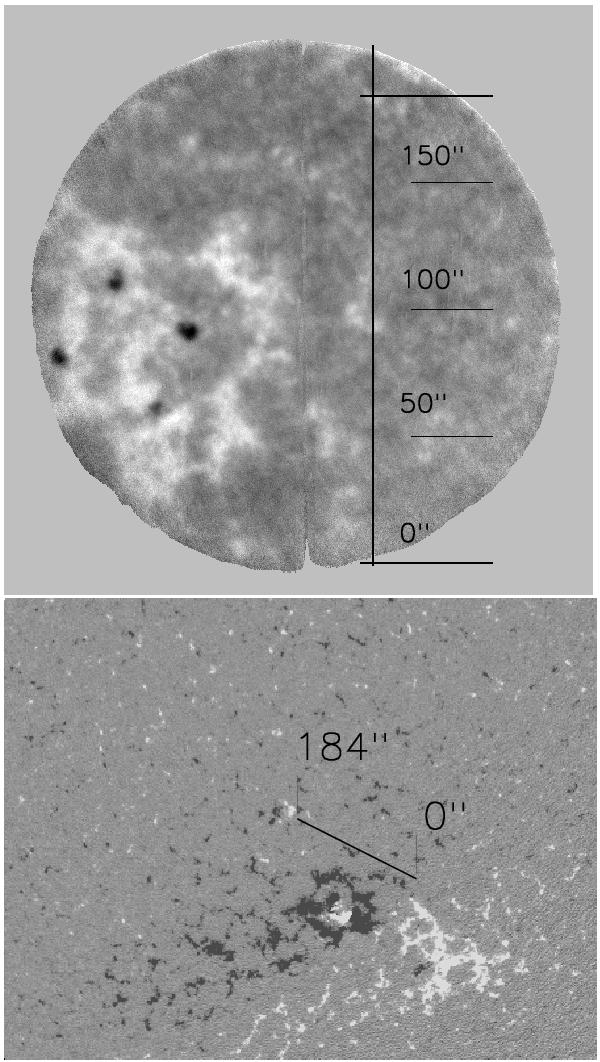
Top panel: the slit jaw image of the region observed on October 15, 2010. Bottom panel: a 900″ × 700″ area of an MDI magnetogram recorded on October 15, 2010, approximately at the same time as our observation. Heliographic north is up. Grey scale cuts at ± 100 G are used. Overplotted is the position of the spectrograph slit.
Current usage metrics show cumulative count of Article Views (full-text article views including HTML views, PDF and ePub downloads, according to the available data) and Abstracts Views on Vision4Press platform.
Data correspond to usage on the plateform after 2015. The current usage metrics is available 48-96 hours after online publication and is updated daily on week days.
Initial download of the metrics may take a while.