Fig. 3
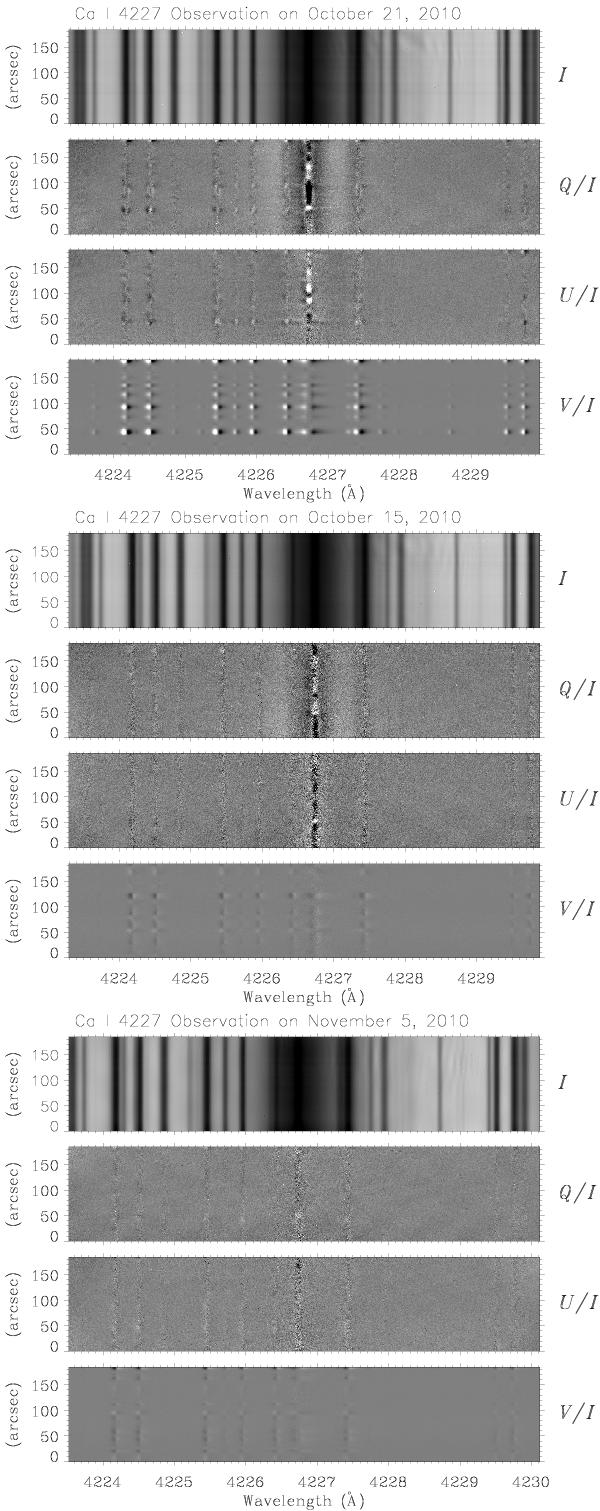
Top observation: the same recording as in Fig. 2 after application of the cross-talk correction and of the linear polarization basis rotation (see text). The measurement was done around μ = 0.94. The second observation (middle) reports measurements of October 15 (around μ = 0.95) in the region shown in Fig. 5. The third observation was done on November 5 (bottom) very close to disk center (μ = 1) in a very quiet region. Here we note the absence of linear polarization signature. For all recordings, the grey scale cuts are the same as in Fig. 2.
Current usage metrics show cumulative count of Article Views (full-text article views including HTML views, PDF and ePub downloads, according to the available data) and Abstracts Views on Vision4Press platform.
Data correspond to usage on the plateform after 2015. The current usage metrics is available 48-96 hours after online publication and is updated daily on week days.
Initial download of the metrics may take a while.