Fig. B.1
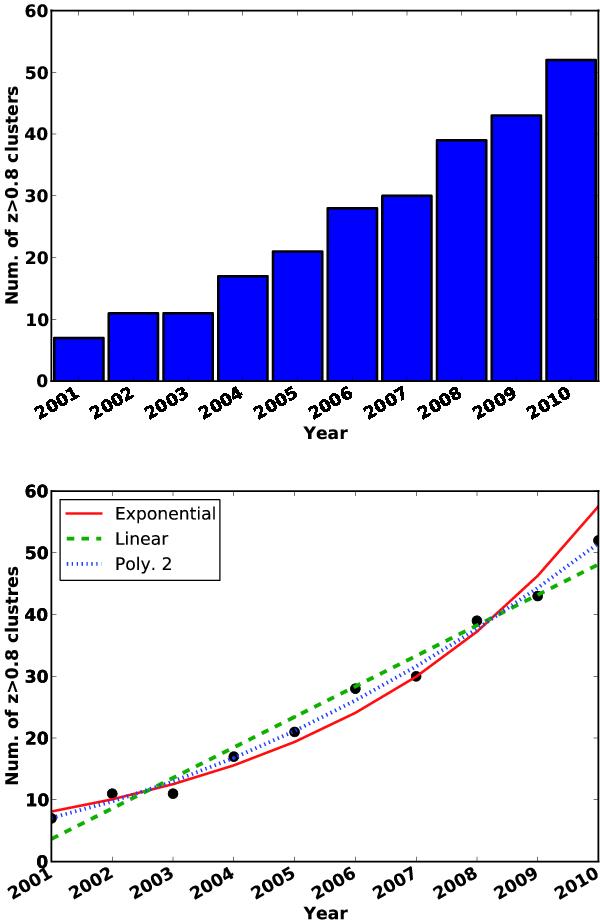
Top: cumulative histogram of the known clusters with spectroscopic redshift >0.8 and an X-ray luminosity measurement compiled by Reichert et al. (2011). Bottom: linear (green dashed line), exponential (red full line) and second order polynomial (blue dotted line) fits to the data in the top panel. See the text for discussion.
Current usage metrics show cumulative count of Article Views (full-text article views including HTML views, PDF and ePub downloads, according to the available data) and Abstracts Views on Vision4Press platform.
Data correspond to usage on the plateform after 2015. The current usage metrics is available 48-96 hours after online publication and is updated daily on week days.
Initial download of the metrics may take a while.