Fig. A.2
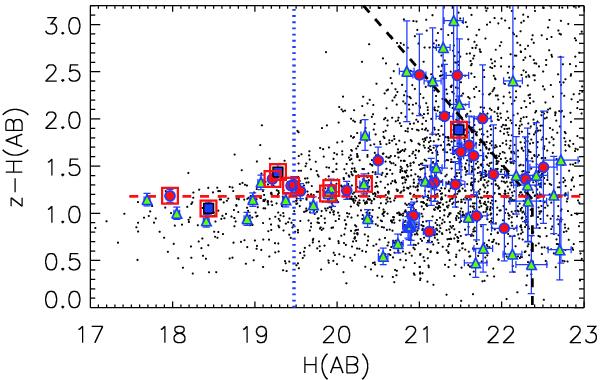
The z − H vs. H color − magnitude diagram of the XMMU J0302.1-0000 cluster’s field. Red boxes mark secure spectroscopic cluster members. Galaxies with projected cluster centric distance less than 30″ are shown as red circles, with distances between 30″−60″ as green triangles. Galaxies with concordant redshift at >60″ distances have blue squares. The dashed black line marks the 50% completeness limit. The apparent H band magnitude of an L∗ galaxy at cluster redshift (z = 0.647) is shown with a vertical blue dotted line. We overplot the z − H color of a solar metallicity SSP model with formation redshift zf = 5 and age ~6.3 Gyr (corresponding to the cluster redshift) as a reference (horizontal red dashed line). The presence of a red sequence with analogous colors is evident.
Current usage metrics show cumulative count of Article Views (full-text article views including HTML views, PDF and ePub downloads, according to the available data) and Abstracts Views on Vision4Press platform.
Data correspond to usage on the plateform after 2015. The current usage metrics is available 48-96 hours after online publication and is updated daily on week days.
Initial download of the metrics may take a while.