Free Access
Fig. A.1
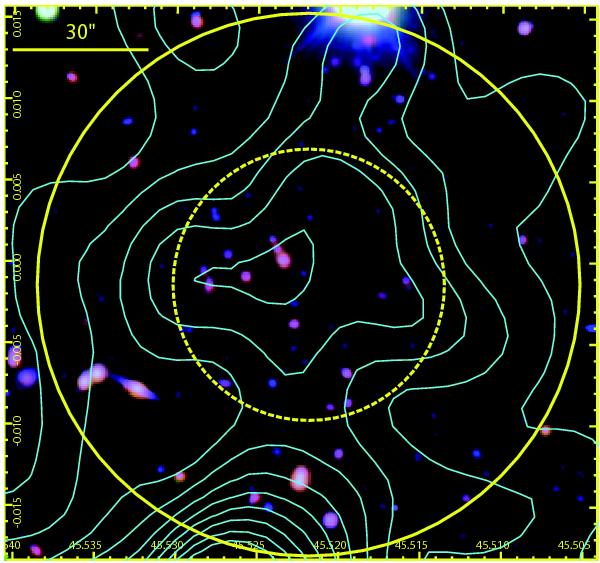
Pseudo-color image of the clusters XMMU J0302.1-0000 (left, red channel: H band, green: z, blue: R). Adaptively smoothed X-ray contours are overlaid in cyan. Solid/dashed circles mark a 60″/30″ radius region centered on the X-ray detection.
Current usage metrics show cumulative count of Article Views (full-text article views including HTML views, PDF and ePub downloads, according to the available data) and Abstracts Views on Vision4Press platform.
Data correspond to usage on the plateform after 2015. The current usage metrics is available 48-96 hours after online publication and is updated daily on week days.
Initial download of the metrics may take a while.