Fig. 4
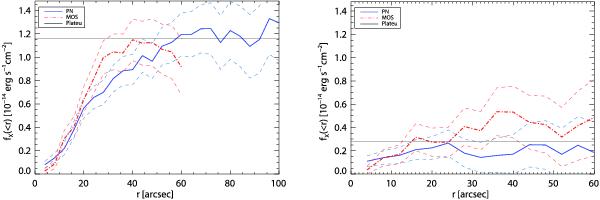
Growth curve analysis of XMMU J0302.2-0001 (z = 1.185, left) and XMMU J1532.2-0836 (z = 1.358, right). The curves show the encircled cumulative flux as a function of radius (PN: blue curve, combined MOS: red, dot-dashed). Dashed lines mark the flux measurement error bars which include the Poisson noise and an additional 5% systematic error from the background estimation. The horizontal lines mark the plateau levels. See Sect. 2.3 for details.
Current usage metrics show cumulative count of Article Views (full-text article views including HTML views, PDF and ePub downloads, according to the available data) and Abstracts Views on Vision4Press platform.
Data correspond to usage on the plateform after 2015. The current usage metrics is available 48-96 hours after online publication and is updated daily on week days.
Initial download of the metrics may take a while.