Fig. 3
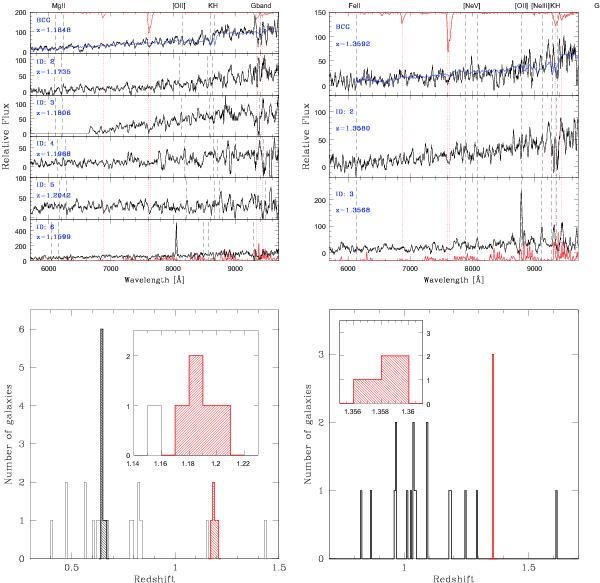
Top: spectra of secure cluster members for XMMU J0302.2-0001 (left, z = 1.185) and XMMU J1532.2-0836 (right, z = 1.358) smoothed with a 7 pixel boxcar filter. The expected observed positions of prominent spectral features at the median redshift are indicated by black dashed lines. The sky spectrum (bottom) and telluric features (top) are overplotted in red. For the BCGs (top panels) we display an overlaid LRG template spectrum in blue. Bottom: distribution of VLT/FORS2 galaxy spectra for the two clusters. The red hashed parts show the distribution of the red galaxies for both clusters (also shown in the insets), selected by requiring the redshift to be within zCL ± 0.015. The black hashed peak in the left panel (at z ≈ 0.65) corresponds to cluster XMMU J0302.1-0000 (see Appendix A). See also Sect. 2.2.2 for discussion.
Current usage metrics show cumulative count of Article Views (full-text article views including HTML views, PDF and ePub downloads, according to the available data) and Abstracts Views on Vision4Press platform.
Data correspond to usage on the plateform after 2015. The current usage metrics is available 48-96 hours after online publication and is updated daily on week days.
Initial download of the metrics may take a while.