Fig. 2
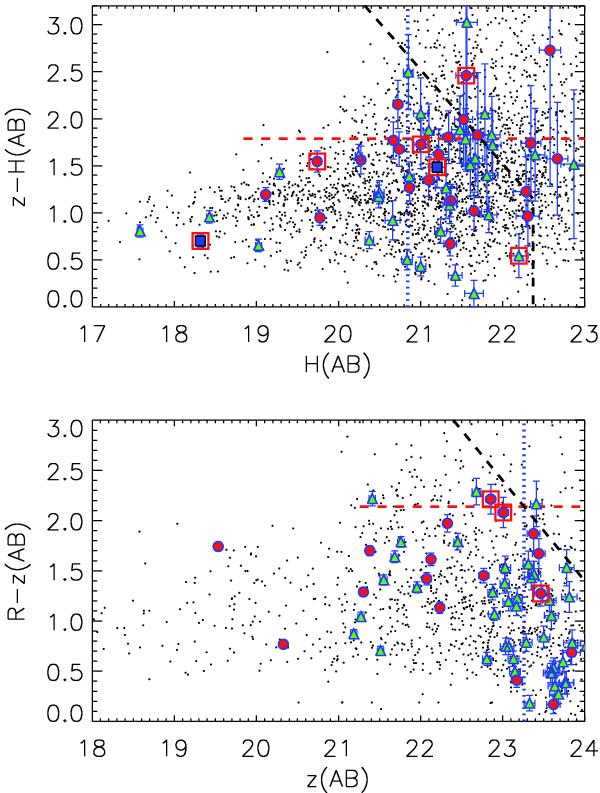
Top: the z − H vs. H color − magnitude diagram (CMD) for XMMU J0302.2-0001. Square boxes mark secure spectroscopic cluster members. Galaxies with projected cluster-centric distances less than 30″ are shown as red circles, those with distances between 30″−60″ as green triangles. Galaxies with concordant redshift at >60″ distances have blue squares. The dashed black line marks the magnitude limits. The apparent H band magnitude of an L∗ galaxy at the cluster redshift is shown with a vertical blue dotted line. To help to guide the eye we overplot the color of a solar metallicity SSP model for the clusters’ redshifts with formation redshift zf = 5 (horizontal red dashed line). Bottom: the R − z vs. z CMD of XMMU J1532.2-0836. The symbols and colors have the same meaning as in the above plot. Two of the spectroscopic members lay on the model prediction for a red sequence at this redshift, the third member has a significantly bluer color.
Current usage metrics show cumulative count of Article Views (full-text article views including HTML views, PDF and ePub downloads, according to the available data) and Abstracts Views on Vision4Press platform.
Data correspond to usage on the plateform after 2015. The current usage metrics is available 48-96 hours after online publication and is updated daily on week days.
Initial download of the metrics may take a while.