| Issue |
A&A
Volume 530, June 2011
|
|
|---|---|---|
| Article Number | A60 | |
| Number of page(s) | 9 | |
| Section | Extragalactic astronomy | |
| DOI | https://doi.org/10.1051/0004-6361/201116832 | |
| Published online | 11 May 2011 | |
Research Note
More evidence for extinction of activity in galaxies
Toruń Centre for Astronomy, N. Copernicus University,
87-100
Toruń,
Poland
e-mail: amr@astro.uni.torun.pl
Received:
4
March
2011
Accepted:
24
March
2011
This Research Note amends an article in which we showed that radio-loud quasars can become radio-quiet. Exploring the analogy between galactic nuclei and X-ray binaries (XRB), we pointed out there that this transition in quasars could be identified with a switch from low/hard to high/soft state in microquasars. Here, we present the evidence that traces of past occurrences of this kind of phenomena can be found in normal but once active galaxies. Based on the properties of a few such “post-active” galaxies that are representative for a much wider group, it has been argued that they have reached the evolutionary stages when their nuclei, which were radio-loud in the past, now, mimicking the behaviour of XRBs, remain in the intermediate state on their way towards quiescence or even have already entered the quiescent state. It follows that the full evolutionary track of XRBs can be mapped onto the evolution of galaxies. The above findings are in line with those reported recently for IC 2497, a galaxy that 70 000 years ago or less hosted a quasar but now appears as a normal one. This scenario stems from the presence of Hanny’s Voorwerp, a nebulous object in its vicinity excited by that QSO in the epoch when IC 2497 was active. The post-active galaxies we deal with here are accompanied by extremely weak and diffuse relic radio lobes that were inflated during their former active period. These relics can be regarded as radio analogues of Hanny’s Voorwerp.
Key words: radio continuum: galaxies / galaxies: active / X-rays: binaries
© ESO, 2011
1. Introduction
The amount of evidence that physical properties of all systems containing a black hole (BH) are qualitatively analogous and quantitatively scalable with the BH mass is substantial – see Marecki & Swoboda (2011), hereafter Paper I, and references therein. Observations of X-ray binaries (XRB), where one of the components is a stellar-mass BH, make it clear that as these objects evolve, they move on the hardness–intensity diagram (HID) along a characteristic path – see Fig. 7 in Fender et al. (2004). However, various changes of the XRBs’ properties expressed in the HID, which can be directly observed, cannot be followed for galaxies, whose central BHs are supermassive, because the pace of the evolution scales with the BH mass (McHardy et al. 2006). Nevertheless, for a large sample of quasars, an analogue of HID called a disc-fraction/luminosity diagram (DFLD) was constructed by Körding et al. (2006). Moreover, the authors transformed the HID of a simulated sample of XRBs into a DFLD and it turned out that these two DFLDs were similar. This way, an important argument was given in favour of the unification and scalability of different classes of object centred on a BH.
We showed in Paper I that galactic nuclei bearing signatures of a transition between fundamentally different areas on DFLD do exist. The three QSOs presented there recently left the radio-loud (RL) very high (VH) state and moved to the radio-quiet (RQ) high/soft (HS) state1. It must be noted, though, that the closed turtle-head-like loops microquasars make in their HIDs are not fully reproduced in DFLDs of quasars. While it is conspicuous that microquasars traverse the HIDs from the HS state to the quiescent state through the intermediate state (Fender et al. 2004), the respective transition for galactic nuclei has not been identified so far. This can be easily explained as a selection effect. Körding et al. (2006) could not show these evolutionary stages in galactic DFLDs for an elementary reason: their study was limited to quasars. Therefore, if we postulate that the analogy between galactic nuclei and XRBs is valid for any evolutionary stage, a gradual cessation of the whole activity is a transition that also has to be allowed for. It follows that a reconstruction of the lower part of the “turtle head” that represents the intermediate and quiescent states in HID could be possible for a DFLD of galaxies if both active and “post-active” ones were taken into account.
The question that arises at this point is whether any signatures of a putative post-active state in galaxies do exist. What we claim is that in some circumstances radio lobes that straddle galaxies can be used as such a signature. Our approach is based on the fact that the lobes of an RL active galaxy are huge reservoirs of energy, so even if relativistic particles from the central engine are no longer supplied to the hotspots, a “coasting” radio source is observable for a substantial amount of time, according to Komissarov & Gubanov (1994) – up to 108 yr. When the energy supply from the central engine to the lobes is cut off eventually, whatever the reason, they become weak and diffuse because of lack of fuelling and have steep spectra caused by radiation and expansion losses. However, hotspots fade out much sooner – their lifetimes are roughly 7 × 10⁴ yr (Kaiser et al. 2000), hence they are normally not seen in coasting lobes, unless shortly after the switch-off of the “central engine”.
We explored the latter possibility in Paper I where we dealt with asymmetric radio sources. What we meant by “asymmetry” was that one lobe was diffuse and devoid of a hotspot, whereas the other resembled a Fanaroff-Riley (Fanaroff & Riley 1974) type-II (FR II) lobe. Assuming that the double did not lie in the sky plane, we attributed the asymmetry to the time lag between their images: the lobe perceived as a relic was nearer than the lobe with a hotspot and consequently it was observed in a later stage of the decay. We concluded that in asymmetric radio sources the transition from RL/VH state to RQ/HS state must have been relatively recent. Here, we focus on double-lobed radio sources where both lobes are already diffuse and deprived of hotspots, and we treat them as a record of their host galaxies’ former – albeit not recent – activity in the radio domain.
Post-active galaxies with extremely diffuse radio lobes.
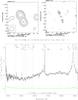 |
Fig. 1 NVSS (upper left) and FIRST (upper right) images of SDSS J082905.01+571541.6. Contours are increased by a factor of 2; the first contour level corresponds to 1 mJy/beam for NVSS image and 0.4 mJy/beam for the FIRST image. Crosses indicate the position of the galactic nucleus. Lower panel: SDSS spectrum of SDSS J082905.01+571541.6. |
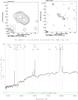 |
Fig. 2 NVSS (upper left) and FIRST (upper right) images of SDSS J123915.40+531414.6. Contours are increased by a factor of 2; the first contour level corresponds to 1 mJy/beam for NVSS image and 0.4 mJy/beam for the FIRST image. Crosses indicate the position of the galactic nucleus. Lower panel: SDSS spectrum of SDSS J123915.40+531414.6. |
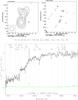 |
Fig. 3 NVSS (upper left) and FIRST (upper right) images of SDSS J152719.44+105015.4. Contours are increased by a factor of 2; the first contour level corresponds to 1 mJy/beam for NVSS image and 0.4 mJy/beam for the FIRST image. Crosses indicate the position of the galactic nucleus. Lower panel: SDSS spectrum of SDSS J152719.44+105015.4. |
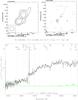 |
Fig. 4 NVSS (upper left) and FIRST (upper right) images of SDSS J155704.67+340309.4. Contours are increased by a factor of 2; the first contour level corresponds to 1 mJy/beam for NVSS image and 0.4 mJy/beam for the FIRST image. Crosses indicate the position of the galactic nucleus. Lower panel: SDSS spectrum of SDSS J155704.67+340309.4. |
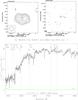 |
Fig. 5 NVSS (upper left) and FIRST (upper right) images of SDSS J130526.77+365521.0. Contours are increased by a factor of 2; the first contour level corresponds to 1 mJy/beam for NVSS image and 0.4 mJy/beam for the FIRST image. Crosses indicate the position of the galactic nucleus. Lower panel: SDSS spectrum of SDSS J130526.77+365521.0. Based on the appearance of this spectrum, SDSS J130526.77+365521.0 is a normal galaxy, although it must have been active and RL before. |
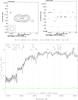 |
Fig. 6 NVSS (upper left) and FIRST (upper right) images of SDSS J144532.17+350253.5. Contours are increased by a factor of 2; the first contour level corresponds to 1 mJy/beam for NVSS image and 0.4 mJy/beam for the FIRST image. Crosses indicate the position of the galactic nucleus. Lower panel: SDSS spectrum of SDSS J144532.17+350253.5. Based on the appearance of this spectrum, SDSS J144532.17+350253.5 is a normal galaxy, although it must have been active and RL before. |
2. The method and the results
The method used in this work was the same as that described in Sect. 2 of Paper I. It relies upon the fundamental property of the images restored from interferometric data: the poorer the coverage of the u − v plane with short baselines, the worse the rendering of extended and diffuse areas of the image lacking compact features. Specifically, the Very Large Array (VLA) in B-conf. used when carrying out the Faint Images of the Radio Sky at Twenty-Centimeters (FIRST) survey (White et al. 1997) fails to show lobes well if they are diffuse, although their presence can be firmly established via NRAO/VLA Sky Survey (NVSS) (Condon et al. 1998). Quantitatively, there is a large discrepancy between the peak and the integrated flux of a lobe if it is of a relic nature. If there is extreme diffuseness, the relic lobes remain undetected in FIRST, while they are evident in NVSS.
For the purpose of the investigation reported in Paper I, we devised an algorithm calculating the ratio of peak-to-integrated flux densities for FIRST catalogue items pertinent to each of the two NVSS lobes. When that ratio was very low for all the FIRST components within the given NVSS lobe, which meant that the lobe was featureless and therefore likely to be diffuse, it was regarded as a potential relic. In a number of cases, the NVSS lobe had no FIRST counterpart and, obviously, we treated these as true positives. Application of the above recipe by means of an automated procedure, later refined by visual inspection of the FIRST maps, led to a selection of 182 targets with at least one lobe being clearly diffuse and deprived of a hotspot.
Whilst Paper I was focused on the objects with one relic and one “active” lobe, having radio cores, and identified with QSOs, we now looked for targets without radio cores2 and with both lobes decaying. Sixty-nine objects of this kind were found in the parent sample consisting of 182. Only two of them – SDSS J082905.01+571541.6 and SDSS J123915.40+531414.6 – were classified as QSOs and as such listed in the quasar catalogue based on Sloan Digital Sky Survey (SDSS) Data Release 7 (Schneider et al. 2010). Some of their physical data taken from Shen et al. (2011) are quoted in Table 2. Their NVSS and FIRST radio maps along with SDSS spectra are shown in Figs. 1 and 2, respectively. Although broad and narrow emission lines typical for QSOs are present there, the continua, unlike in QSOs, do not rise towards the blue end of the spectra. This makes labelling these two objects as quasars questionable. Instead, they should be named radio galaxies, but the diffuse nature of their radio lobes casts doubt on this classification as well.
The remaining 67 objects are listed in Table 1. Given that on the one hand they are all double lobed in NVSS maps but on the other their lobes are extremely diffuse as seen – or better yet: hardly or even not seen – in FIRST, they could be labelled post-active. Eleven out of those 67 are not included in SDSS, therefore their (approximate) coordinates shown in Table 1 we extracted from NVSS. The remaining 56 are itemised in SDSS but spectra have been provided for only eighteen. Redshifts calculated from those spectra are listed in Col. 4 of Table 1. To date, no other redshift information pertinent to the galaxies from Table 1 is available in the NASA/IPAC Extragalactic Database.
3. Interpretation of the observational material
Along with the results presented in Paper I, this work is an endeavour to identify the evolutionary track of galaxies in which the nuclear activity switched off. Originally, they were RL, i.e., they remained in a VH state. When their activity in the radio domain – but only in this domain – had ceased, they moved to the HS state. Three objects of that kind were shown in Paper I. Its outcome and related considerations in the literature quoted therein provide a sound basis for a notion of a common evolutionary path of XRBs and galactic nuclei. It implies that galactic nuclei, once active, can leave the HS state and, like XRBs, enter the intermediate state on their way to quiescence, which means they become post-active. Objects shown in Figs. 1 and 2 are representative for the initial stage of such a transition. Although officially labelled QSOs (Schneider et al. 2010; Shen et al. 2011) and even though the emission lines are still present in their spectra, neither the continua nor very low Eddington ratios – see the last column of Table 2 – resemble those of bona fide quasars. Most intriguing here, however, are radio lobes straddling each of these two: being diffuse and devoid of hotspots, they are clearly in the coasting phase. As mentioned in Sect. 1, this can be noticeably long – up to 108 yr (Komissarov & Gubanov 1994) – so assuming that formerly RL galactic nuclei could enter, stay, and leave HS state all within that time, a reminiscence of the past RL episode in the form of relic radio lobes could indeed be observed.
Quasar-like objects for which both radio lobes are relics.
Obviously, the later the evolutionary stage, the more advanced the decay of relics as shown in the examples in Figs. 3 and 4. Here, the lobes are even more dispersed compared to those in Figs. 1 and 2. This shift of the radio appearance has, in turn, a counterpart in the optical domain where the signatures of activity have faded out nearly completely: the continuum is typical for normal galaxies, broad lines have disappeared, and only single narrow lines are present. A further assumption that could be made is that the inclusion of the whole time spent in the intermediate state to the above time budget would still allow for it to remain within the 108 yr limit. If this is correct, galaxies should exist that show no signatures of activity in their optical spectra at all but are straddled with extremely weak relic radio lobes. Based on the examples shown in Figs. 5 and 6, this could be the case. The SDSS spectra of SDSS J130526.77+365521.0 and SDSS J144532.17+350253.5 indicate that they are normal galaxies, yet are accompanied by radio relics, albeit diffuse to such an extent that VLA in B-conf. was unable to render them in FIRST.
The extinction of activity in galaxies is certainly not limited to those listed in Table1. To date, perhaps the most spectacular evidence of a past activity in a galaxy that currently appears as normal was brought by Schawinski et al. (2010) for IC 2497. No more than 70 000 years ago, it hosted a luminous quasar, the light echo of which is now observable in the form of a nebulous object known as Hanny’s Voorwerp, located 15–25 kpc (in projection) from IC 2497. The authors point out that the “death” of the QSO hosted by IC 2497 must have been sudden so that, statistically, objects similar to Hanny’s Voorwerp should be very rare because of their ephemeral nature. Two objects in our sample – SDSS J082905.01+571541.6 and SDSS J123915.40+531414.6 shown in Figs. 1 and 2, respectively – are also rare and accordingly likely to remain in a short, transitional phase. It can be speculated that this is earlier than the current evolutionary stage of IC 2497. On the other hand, the remaining four presented here in some detail are clearly post-active but, unlike for IC 2497, radio relics instead of optical relics are the protagonists of their past active episode.
4. Summary
We attempted to show an evolutionary path for galactic nuclei analogous to that of XRBs between VH state and quiescence. The presence of radio lobes inflated in the VH state but later gradually dispersing and fading out makes it possible to discern three stages of the evolution of galactic nuclei that follow the VH state: the HS, intermediate, and quiescence. The switch to the HS state was covered in Paper I. In this work, optical and radio signatures of the two remaining stages have been pointed out.
Acknowledgments
This research has made use of the NASA/IPAC Extragalactic Database (NED), which is operated by the Jet Propulsion Laboratory, California Institute of Technology, under contract with the National Aeronautics and Space Administration. Funding for the SDSS and SDSS-II has been provided by the Alfred P. Sloan Foundation, the Participating Institutions, the National Science Foundation, the US Department of Energy, the National Aeronautics and Space Administration, the Japanese Monbukagakusho, the Max Planck Society, and the Higher Education Funding Council for England. The SDSS Web Site is http://www.sdss.org/. The SDSS is managed by the Astrophysical Research Consortium for the Participating Institutions. The Participating Institutions are the American Museum of Natural History, Astrophysical Institute Potsdam, University of Basel, University of Cambridge, Case Western Reserve University, University of Chicago, Drexel University, Fermilab, the Institute for Advanced Study, the Japan Participation Group, Johns Hopkins University, the Joint Institute for Nuclear Astrophysics, the Kavli Institute for Particle Astrophysics and Cosmology, the Korean Scientist Group, the Chinese Academy of Sciences (LAMOST), Los Alamos National Laboratory, the Max-Planck-Institute for Astronomy (MPIA), the Max-Planck-Institute for Astrophysics (MPA), New Mexico State University, Ohio State University, University of Pittsburgh, University of Portsmouth, Princeton University, the United States Naval Observatory, and the University of Washington.
References
- Condon, J. J., Cotton, W. D., Greisen, E. W., et al. 1998, AJ, 115, 1693 [NASA ADS] [CrossRef] [Google Scholar]
- Fanaroff, B. L., & Riley, J. M. 1974, MNRAS, 167, 31P [Google Scholar]
- Fender, R. P., Belloni, T. M., & Gallo, E. 2004, MNRAS, 355, 1105 [NASA ADS] [CrossRef] [Google Scholar]
- Kaiser, C. R., Schoenmakers, A. P., & Röttgering, H. J. A. 2000, MNRAS, 315, 381 [Google Scholar]
- Komissarov, S. S., & Gubanov, A. G. 1994, A&A, 285, 27 [NASA ADS] [Google Scholar]
- Körding, E. G., Jester, S., & Fender, R. P. 2006, MNRAS, 372, 1366 [NASA ADS] [CrossRef] [Google Scholar]
- Marecki, A., & Swoboda, B. 2011, A&A, 525, A6 (Paper I) [NASA ADS] [CrossRef] [EDP Sciences] [Google Scholar]
- McHardy, I. M., Körding, E. G., Knigge, C., Uttley, P., & Fender, R. P. 2006, Nature, 444, 730 [NASA ADS] [CrossRef] [PubMed] [Google Scholar]
- Schawinski, K., Evans, D. A., Virani, S., et al. 2010, ApJ, 724, L30 [NASA ADS] [CrossRef] [Google Scholar]
- Schneider, D. P., Richards, G. T., Hall, P. B., et al. 2010, AJ, 139, 2360 [NASA ADS] [CrossRef] [Google Scholar]
- Shen, Y., Hall, P. B., Richards, G. T., et al. 2011, ApJS, in press [arXiv:1006.5178] [Google Scholar]
- White, R. L., Becker, R. H., Helfand, D. J., & Gregg, M. D. 1997, ApJ, 475, 479 [NASA ADS] [CrossRef] [Google Scholar]
All Tables
All Figures
|
Fig. 1 NVSS (upper left) and FIRST (upper right) images of SDSS J082905.01+571541.6. Contours are increased by a factor of 2; the first contour level corresponds to 1 mJy/beam for NVSS image and 0.4 mJy/beam for the FIRST image. Crosses indicate the position of the galactic nucleus. Lower panel: SDSS spectrum of SDSS J082905.01+571541.6. |
| In the text | |
|
Fig. 2 NVSS (upper left) and FIRST (upper right) images of SDSS J123915.40+531414.6. Contours are increased by a factor of 2; the first contour level corresponds to 1 mJy/beam for NVSS image and 0.4 mJy/beam for the FIRST image. Crosses indicate the position of the galactic nucleus. Lower panel: SDSS spectrum of SDSS J123915.40+531414.6. |
| In the text | |
|
Fig. 3 NVSS (upper left) and FIRST (upper right) images of SDSS J152719.44+105015.4. Contours are increased by a factor of 2; the first contour level corresponds to 1 mJy/beam for NVSS image and 0.4 mJy/beam for the FIRST image. Crosses indicate the position of the galactic nucleus. Lower panel: SDSS spectrum of SDSS J152719.44+105015.4. |
| In the text | |
|
Fig. 4 NVSS (upper left) and FIRST (upper right) images of SDSS J155704.67+340309.4. Contours are increased by a factor of 2; the first contour level corresponds to 1 mJy/beam for NVSS image and 0.4 mJy/beam for the FIRST image. Crosses indicate the position of the galactic nucleus. Lower panel: SDSS spectrum of SDSS J155704.67+340309.4. |
| In the text | |
|
Fig. 5 NVSS (upper left) and FIRST (upper right) images of SDSS J130526.77+365521.0. Contours are increased by a factor of 2; the first contour level corresponds to 1 mJy/beam for NVSS image and 0.4 mJy/beam for the FIRST image. Crosses indicate the position of the galactic nucleus. Lower panel: SDSS spectrum of SDSS J130526.77+365521.0. Based on the appearance of this spectrum, SDSS J130526.77+365521.0 is a normal galaxy, although it must have been active and RL before. |
| In the text | |
|
Fig. 6 NVSS (upper left) and FIRST (upper right) images of SDSS J144532.17+350253.5. Contours are increased by a factor of 2; the first contour level corresponds to 1 mJy/beam for NVSS image and 0.4 mJy/beam for the FIRST image. Crosses indicate the position of the galactic nucleus. Lower panel: SDSS spectrum of SDSS J144532.17+350253.5. Based on the appearance of this spectrum, SDSS J144532.17+350253.5 is a normal galaxy, although it must have been active and RL before. |
| In the text | |
Current usage metrics show cumulative count of Article Views (full-text article views including HTML views, PDF and ePub downloads, according to the available data) and Abstracts Views on Vision4Press platform.
Data correspond to usage on the plateform after 2015. The current usage metrics is available 48-96 hours after online publication and is updated daily on week days.
Initial download of the metrics may take a while.