Fig. 14
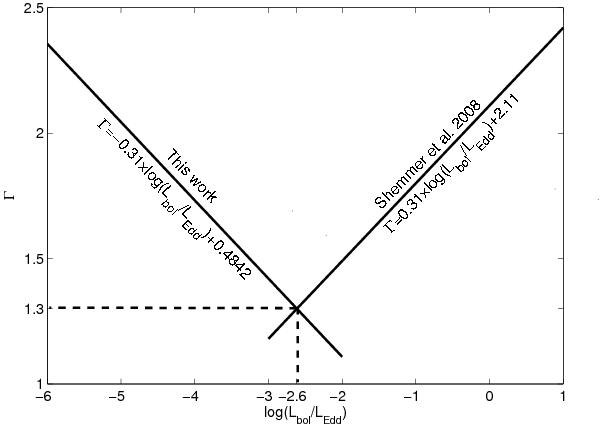
Dependence of Γ as a function of the Eddington ratio. The positive and negative correlations represent the ones found for a sample of luminous AGNs (Shemmer et al. 2008) and for our sample of LINER 1s respectively. Note here that the intercept of our anticorrelation has changed since now we are considering Lbol instead of L2−10 keV. The crosspoint between the two lines represents a probable transitional point from a standard thin accretion disk to a RIAF in AGNs.
Current usage metrics show cumulative count of Article Views (full-text article views including HTML views, PDF and ePub downloads, according to the available data) and Abstracts Views on Vision4Press platform.
Data correspond to usage on the plateform after 2015. The current usage metrics is available 48-96 hours after online publication and is updated daily on week days.
Initial download of the metrics may take a while.