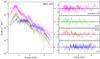
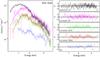
Fig. 9

Upper left panel. Data and best fit model of the different spectra of NGC 315. A hardening in the Chandra ACIS spectrum (in blue) above ~1.5 keV is seen, relative to the XMM-Newton spectra (burgundy, green, and orange). Upper right panel. Residuals of the best fit model in terms of sigma. Lower left panel. Data and best fit model of the different spectra of NGC 3226. It is clear that more absorption below 2 keV from cold material is taking place between the two XMM-Newton observations (black representing the long ~100 ks observation). Lower right panel. Residuals of the best fit model in terms of sigma.
Current usage metrics show cumulative count of Article Views (full-text article views including HTML views, PDF and ePub downloads, according to the available data) and Abstracts Views on Vision4Press platform.
Data correspond to usage on the plateform after 2015. The current usage metrics is available 48-96 hours after online publication and is updated daily on week days.
Initial download of the metrics may take a while.