Free Access
Fig. 8
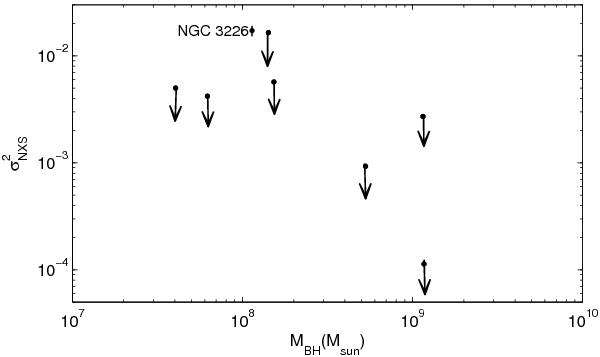
 derived from the XMM-Newton observations as a function of the BH mass for our sample of LINER 1s. Arrows represent upper limits. NGC 3226 is the only source showing clear short time-scale (~1 day) variability and thus a non-upper limit value on .
Current usage metrics show cumulative count of Article Views (full-text article views including HTML views, PDF and ePub downloads, according to the available data) and Abstracts Views on Vision4Press platform.
Data correspond to usage on the plateform after 2015. The current usage metrics is available 48-96 hours after online publication and is updated daily on week days.
Initial download of the metrics may take a while.