| Issue |
A&A
Volume 530, June 2011
|
|
|---|---|---|
| Article Number | A74 | |
| Number of page(s) | 4 | |
| Section | Extragalactic astronomy | |
| DOI | https://doi.org/10.1051/0004-6361/201116794 | |
| Published online | 12 May 2011 | |
The puzzling temporally variable optical and X-ray afterglow of GRB 101024A
1 ASI Science Data Center, via Galileo Galilei, 00044 Frascati (RM), Italy
e-mail: This email address is being protected from spambots. You need JavaScript enabled to view it.
2
University of Western Australia, School of Physics/ICRAR, W.A. 6009 Crawley, Australia
3
University of Western Australia, School of Physics, W.A. 6009 Crawley, Australia
4
Institut de Recherche en Astrophysique et Planetologie, 9 avenue du colonel Roche, 31028 Toulouse, France
5
Observatoire de Haute Provence (CNRS), 04780 Saint Michel l’Observatoire, France
6
Centre for Backyard Astrophysics, 3842 Churchill Victoria, Australia
Received: 27 February 2011
Accepted: 11 April 2011
Abstract
Aims. We present the optical observations of the afterglow of the Swift burst GRB 101024A and try to reconcile these observations with the X-ray afterglow data of GRB 101024A using current afterglow models
Methods. We employ early optical observations, using the Zadko Telescope combined with X-ray data, to compare them with the reverse shock/forward shock model.
Results. The early optical light curve reveals a very unusual steep decay index of α ~ 5. This is followed by a flattening and possibly a plateau phase coincident with a similar feature in the X-ray. We discuss these observations in the framework of the standard reverse shock/forward shock model and energy injection. The plateau phase might also be the signature of the formation of a new magnetar.
Key words: gamma-ray burst: general
© ESO, 2011
1. Introduction
Gamma-ray bursts (GRBs) are the most powerful explosions in the Universe ever since the Big Bang (see e.g. Mészáros 2006, for a review). GRBs are thought to be the signature of the formation of a black hole via the collapse of a massive star in a hypernova or the merging of two compact objects (Mészáros 2006). It has also been proposed that newborn magnetars could also manifest as GRBs (Dai & Lu 1998). The gamma-ray burst is observed for the first seconds of the event, followed by an afterglow at longer wavelengths. However, in a few cases, coincident optical and GRB emission has been observed (see Gendre et al. 2009, for a recent global view of the early part of the optical light curve), and for this reason it is more correct to call this initial part of the phenomenon the prompt phase of the burst.
In the most commonly accepted model, the radiation mechanism is supposed to be synchrotron radiation from an expanding fireball (Rees & Mészáros 1992; Mészáros & Rees 1997; Panaitescu et al. 1998). In the first model, all the parameters of the fireball are fixed at the start, and the observed light curve shape should be very simple (Sari et al. 1998; Sari & Piran 1999). Swift has, however, shown that this view was too simplistic, because in the X-ray part alone, the afterglow shows unexpected features, such as flares, a plateau phase, chromatic breaks, and the absence of an achromatic late break. These features are not explained by this model (see e.g. Gendre et al. 2010). Among these features, the plateau phase is one of the most complicated to explain. It is thought to be due to late energy injection in the fireball (e.g. Panaitescu et al. 2006) or the emergence of the afterglow hidden during the early part by the end of the prompt phase (Willingale et al. 2007; see Zhang 2007 for a complete review). These interpretations lack the support of multi-wavelength observations. In almost all cases, they are used to explain the observed light curve in a given band without knowledge of other bands (and/or the spectral properties): as emphasized above, the GRB phenomenon is a multi-wavelength phenomenon.
In this paper, we present the observations of GRB 101024A observed by Swift and several robotic telescopes. We highlight the properties of GRB 101024A in Sects. 2 and 3; and discuss the early optical phase in Sect. 4 and the plateau nature in Sect. 5 before concluding. All errors are given at the 90% confidence level.
2. GRB 101024A
GRB 101024A was detected by the Swift satellite (Gehrels et al. 2004) at 11:39:29.8 UT (hereafter denoted T0) on 2010 October 24 (De Pasquale et al. 2010), and also observed by Fermi (McBreen et al. 2010). We analyzed the BAT and Fermi prompt data, and obtained a duration of T90 = 18.7 ± 0.5 s and a best-fit spectral parameter of Γ = 0.7 ± 0.4,  keV using a cut-off power law. The XRT position of the burst is RA = 04h26m1.51s Dec = − 77deg15′55.4″ with an uncertainty of 1.8″ (Beardmore et al. 2010). Because of its position in the sky and the time at which the burst occurred, only a few robotic telescopes responded to the alert in optical. The Zadko telescope (Coward et al. 2010) was the first to observe the optical afterglow. Laas-Bourez et al. (2010a) report the observation of a fading afterglow. The afterglow was also observed by GRAS06 (Hentunen et al. 2010) and by AAVSO International High Energy Network (Stockdale 2010). Finally, the UVOT onboard Swift reported observations of the afterglow in the U and V bands (De Pasquale et al. 2010).
The afterglow decayed very quickly: about 20 h after the trigger, it was too faint to be detected by the X-Shooter mounted on the VLT-2 unit (D’Elia 2010, priv. comm.). However, a follow up by GROND (Greiner et al. 2008) about two days after the burst detected a faint object at the position of the afterglow at R = 24.2 mag (Kruehler et al. 2010). Swift terminated the follow-up 2.14 days after the trigger.
3. Data reduction and analysis
3.1. X-ray data
All the XRT observations performed for this burst are quoted in Table 1. The X-ray light curve, taken from the XRT repository (see Evans et al. 2007), shows the typical steep-flat-steep decay, as observed in about 70% of the Swift GRBs (e.g. Liang et al. 2009). A double broken power law model provides an excellent fit to the X-ray light curve ( with 53 degrees of freedom), with best-fit decay indexes αX, 1 = 2.3 ± 0.9, αX, 2 = −0.04 ± 0.02, and αX, 3 = 1.34 ± 0.07 and break times at
  s and
s and  s after the trigger.
The hardness ratio between the 1.5 − 10 keV band and the 0.3 − 1.5 keV band shows some variability with time, in particular during the plateau, where no spectral variation is typically observed. However, a time-resolved spectral analysis in the temporal ranges 100–300 s, 300–700 s, 4.0–10.0 ks, and 10.0–98.9 ks after the trigger, shows that this behavior is not statistically significant. The average spectrum is well fitted by an absorbed power law. Assuming two absorption components, one fixed at the Galactic value of NH = 6.5 × 1020 cm-2 (Kalberla et al. 2005) and the second free to vary, the best-fit parameters are β = 1.0 ± 0.1 and an intrinsic absorption of  cm-2.
cm-2.
Swift/XRT observations of GRB 101024A.
Observations of GRB 101024A in the optical.
3.2. Zadko optical data
GRB 101024A was observed near the south celestial pole and occurred at a time when only Australia was able to observe it. As such, few optical data are available. We undertook a complete re-analysis of the Zadko data announced in Laas-Bourez et al. (2010b) and the AAVSO data reported by Stockdale (2010), in order to obtain the best confidence photometric values reported in this paper. We performed aperture photometry using the AudeLa software1 (Klotz et al. 2008), and list the photometry results in Table 2. The large uncertainties (0.3 mag) come from the reference star uncertainties extracted from the NOMAD1 catalog.
For completeness, we also retrieved all available optical observations of this burst from GCN circulars, and list them in Table 2, together with the Zadko telescope observations. Values reported from GRAS06 telescope have been checked by the GRAS06 team (Hentunen 2010, priv. comm.). Because of the afterglow faintness, the UVOT onboard Swift reported only upper limits in the temporal range used in this work, so they are not reported.
We plot the optical light curve in Fig. 1. As can be seen, the initial part of the optical light curve is quite similar to the canonical Swift X-ray light curve, i.e. a fast decay followed by a plateau, and a late steepening; however, the optical late part is quite strange. Indeed, the GROND observation is not compatible with the decay rate measured from the AAVSO observations. These observations, in turn, are not compatible with the GRAS06 ones. This could be due to an optical flare between ~ 2000 and 4000 s after the burst. However, the GROND data are also not compatible with the decay rate measured from the GRAS06 data. This last deviation is not very large, and could be due either to a fluctuation of the optical afterglow or to a contribution of the host galaxy. Because of the lack of follow-up, we cannot conclude whether this late GROND observation is the afterglow or rather the host galaxy.
We tried to fit the light curve using broken power laws. If the early (< ~ 1500 s) optical light curve can be described as a broken power law with best-fit parameters of αO, 1 = 5.3 ± 0.1, tb, 1 = 263 ± 9 s, αO, 2 = 0.6 ± 0.1, the late decay cannot be fitted with these models (the best  we obtained was 6.8, allowing one more break). This high value of , together with the residual analysis, makes us conclude that the usual power-law decay is not applicable to this afterglow, even when removing the last GROND observation (assumed to be affected by the host galaxy luminosity), and that another component is at play within the optical data.
Finally, we note that the last Zadko data features a steady flux, compatible with what is observed in X-rays. Applying the X-ray best-fit light-curve model to the optical data we find that both the plateau decay index and the epoch at the end of the observations (tbreak, 2) are consistent with the optical data (see Fig. 2). However, the post-plateau decay would overpredict the second GRAS06 point of about 4 sigma, while the late time GROND data would be ~ 3 sigma above the predicted flux (consistent with the presence of a host galaxy), indicating again the need of another optical component. In addition, in order to reproduce the early optical light curve, a Gaussian (optical peak: 157 s after the trigger; peak width: 50 s) has to be superimposed on the X-ray best-fit broken power-law model.
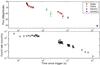 |
Fig. 1 Light curve of GRB 101024A in optical (top panel) and X-ray (bottom panel). |
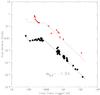 |
Fig. 2 The X-ray best fit light curve (in black) compared to the optical data points (in red). See the electronic edition for colors. |
4. The early optical afterglow
Zadko observations show an early optical steep decay, starting 218 s after the burst up to about 230 s. The steepness smooths to a shallower decay. While the plateau decay rate and the following steepening epoch are consistent with that measured from the X-ray light curve, the early optical behavior is not tracked in the X-ray, suggesting a separate component.
The early optical light curve of 101024A may be interpreted as reverse shock afterglow emission. However, the initial decay index αO, 1 is much higher than the expected value (~2 Kobayashi 2000, see also Corsi et al. in prep.). We note, however, that a shift in the T0 value may reduce this large decay index (see e.g. Lazzati & Begelman 2006).
In some GRBs, the high-energy prompt emission revealed an optical counterpart. We investigate whether this may be the case for GRB 101024A. The high-energy (15–350 keV) prompt emission ended about 20 s after the trigger, and about 200 s before the optical observation. Such a large temporal lag between high- energy and optical emission do not support this interpretation.
The steep decay during the early part of the optical light curve, together with the global behavior of the late optical data, may also suggest the presence of flaring activity. Other GRBs showed such features (e.g. GRB 030329, GRB 021004). GROND observations (e.g. GRB 081029, Nardini et al. in preparation) have recently shown strong optical flaring activity (or re-brightening), superimposed on the afterglow decay (see also Greiner 2011). It has been proposed that ISM density enhancement of a factor of about 10 may produce early optical flares or rebrightening, with a different origin than the one typically invoked for X-ray afterglows (i.e. internal shocks Lazzati et al. 2002). In such a case, the absence of simultaneous flares observed in X-ray occurs because above the cooling frequency, the radiation mechanism is not sensitive to the surrounding medium density.
We used the closure relations between the decay and spectral indices applying to the late afterglow (Sari et al. 1998; Sari & Piran 1999) to constrain the fireball regime. The equation α − 1.5β = 0.0 agrees within errors with the values of αX, 3 and β. This indicates that for GRB 101024A the X-ray band is below the cooling frequency if the surrounding medium is an InterStellar Medium (ISM) and that p = 2.8 ± 0.1. No other cases of the standard model apply for this burst (see Gendre et al. 2007, for a list of closure relations tested on GRB 101024A). In such a case, the X-ray band should be sensitive to the clumpy medium and reproduce the optical flares. Moreover, because the cooling frequency decreases with time for an ISM, this consideration should also be true during the early afterglow. Even though the late X-ray light curve presents small fluctuations that may trace the small flares seen at the same time in the optical, this is not the case for the initial steep decay. Thus, the clumpy medium interpretation does not apply to the initial data of GRB 101024A.
5. The plateau
5.1. Standard model
In the standard model, it is possible to observe a rising part in the afterglow if the injection frequency has not crossed the observation band. In such a case, the decay index should be 1/6 (Sari et al. 1998). The value we obtained in the X-ray light curve during the plateau for αX, 2 is compatible with this value within 3 sigma. Once the injection frequency has crossed the observation band, we should observe a decay index between 0.7 and 1.3 (depending on the cooling regime and the fireball parameters), which is again compatible with the value of αX, 3. However, in such a case, we should also observe some spectral variation, which is not observed in the case of this burst. Therefore, we can reject the hypothesis that the plateau phase is due to the standard model normal evolution.
5.2. Energy injection
Several authors (e.g. Panaitescu et al. 2006) have proposed accounting for the plateau phase by injecting energy into the fireball. We recall here that the afterglow is emitted by a population of accelerated electrons that radiate by synchrotron effect into a magnetic field produced by the fireball itself. Accordingly, there are three methods of injecting energy: by inserting some energy into the fireball (by shocks), by transferring some unused energy from the fireball into the electron (modifying the ϵe parameter), and by increasing the magnetic field of the fireball (modifying the ϵB parameter).
The observed flux can be expressed as 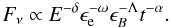 (1)If one (or a combination) of Eδ,
  , or
, or  is proportional to t + α, then the light curve will feature a plateau. The difficulty of this model is that the modification of the temporal decay does not depend on the wavelength, i.e. assuming that the optical and X-ray bands are in the same cooling regime the plateau is observed at both wavelengths. In addition, if a specific frequency (e.g. the cooling frequency) lies between the optical and X-ray bands, then the optical band decay will not be identical to the X-ray one. However, at the end of the energy injection (i.e. at the end of the X-ray plateau) the optical light curve will feature a break. In several cases where energy injection is claimed, the presence of this break is not checked in available data or even ruled out by the observations, see e.g. Xin et al. (2010), Cusumano et al. (2006), or Nousek et al. (2006). The simultaneity of the break can be relaxed if one removes one of the main hypotheses of the fireball model: that the electron population is distributed according to a single power law.
In the case of GRB 101024A however, as we noted in Sect. 3.2, if we assume that the initial steep decay is not linked to the afterglow, the data cannot rule out a simultaneity of the breaks in optical and in X-ray, as expected in the case of energy injection. However, the optical data are too scarce to confirm the energy injection as the only explanation for the plateau phase, and we conclude that energy injection during the plateau phase is not excluded by the data and may explain the plateau phase.
5.3. Gravitational waves
The shallow decay phase in the early X-ray afterglows of GRBs may be the signature of the formation of a highly magnetized millisecond pulsar, pumping energy into the fireball on longer timescales than the prompt emission. This scenario has also led to the more speculative idea of the nascent neutron star undergoing rotational instabilities, so-called “bar modes”. A neutron star undergoing a bar mode instability would be a strong gravitational wave source. Corsi & Meszaros (2009) argue that the GRB early afterglow plateau could be a “smoking gun” for gravitational wave emission and a target for advanced LIGO and Virgo.
Assuming that GRB 101024A follows this evolutionary scenario, could it have been detected by advanced LIGO? Given the expected gravitational wave luminosity from a bar mode instability, and the sensitivity of Advanced LIGO, it would probably not be detectable unless GRB 101024A occurred in a host galaxy at a distance less than about 150 Mpc. Nonetheless, it is an exciting prospect that the potential exists for probing the strong gravity regime of compact objects in both the electromagnetic and gravitational wave spectra.
6. Conclusions
We have presented observations of GRB 101024A obtained with the Zadko telescope in optical and with Swift at high energy. In the optical, the afterglow data reveal a complicated behavior. The light curve first decay with a large and unusual decay index, which cannot be understood in the standard framework of the fireball model. After this strong decay, the light curve features a flattening. The simultaneously observed X-ray data feature a plateau that could indicate late energy injection. The optical data do not rule out this hypothesis. The optical light curve also features erratic behavior with late rebrightening, with no clear explanation. Finally, we note that the last observation of this burst made by GROND has not clear explanation. It could be either another very late flare or the consequence of the host galaxy luminosity. Another deep photometric observation on a 8m class telescope could resolve this mystery.
The GRB 101024A optical data are too sparse to provide a complete analysis of the burst properties. We note that this highlights the problem of a lack of ground-based follow-up of GRB afterglows. If a burst commenced during the European night, it can be continuously followed by small robotic telescopes in Europe, medium-size instruments in the Canary Islands, large facilities in the USA, and in Chile over 12 h. Conversely, a burst occurring when the night is almost finished in South America will be poorly sampled by the Australian and Japanese facilities. This geographic bias could be helped by the robotization of several 2 to 4 m class telescopes at Australian and African longitudes.
Acknowledgments
Thanks go to V.P. Hentunen who kindly provided the updated and verified data from the GRAS06 telescope. This work made use of data supplied by the UK Swift Science Data Centre at the University of Leicester. This work has been financially supported by the GdR PCHE and the GDRE “Exploring the Dawn of the Universe with Gamma-Ray Bursts” in France, and from the Italian Space Agency (ASI). We finally thank an anonymous referee for his/her valuable comments.
References
- Beardmore, A. P., Evans, P. A., Goad, M. R., & Osborne, J. P. 2010, GCN #11372 [Google Scholar]
- Corsi, A., & Meszaros, P. 2009, ApJ, 702, 1171 [NASA ADS] [CrossRef] [Google Scholar]
- Coward, D. M., Todd, M., Vaalsta, T. P., et al. 2010, PASA, 27, 331 [NASA ADS] [Google Scholar]
- Cusumano G., Mangano, V., Angelini, L., et al. 2006, ApJ, 639, 316 [NASA ADS] [CrossRef] [Google Scholar]
- Dai, Z. G., & Lu, T. 1998, A&A, 333, 87 [Google Scholar]
- Evans, P. A., Beardmore, A. P., Page, K. L., et al. 2007, A&A, 469, 379 [NASA ADS] [CrossRef] [EDP Sciences] [Google Scholar]
- Gehrels, N., Chincarini, G., Giommi, P., et al. 2004, ApJ, 611, 1005 [NASA ADS] [CrossRef] [Google Scholar]
- Gendre, B., Galli, A., Corsi, A., et al. 2007, A&A, 462, 565 [NASA ADS] [CrossRef] [EDP Sciences] [Google Scholar]
- Gendre, B., Corsi, A., Cutini, S., et al. 2009, AIP Conf. Proc., 1133, 175 [NASA ADS] [CrossRef] [Google Scholar]
- Gendre, B., Klotz, A., Palazzi, E., et al. 2010, MNRAS, 405, 2372 [NASA ADS] [Google Scholar]
- Greiner, J. 2011, to appear in Gamma-Ray Bursts, ed. C. Kouveliotou, S. E. Woosley, & R. Wijers (Cambridge University Press) [arXiv:astro-ph/1102.0472] [Google Scholar]
- Greiner, J., Bornemann, W., Clemens, C., et al. 2008, PASP, 120, 405 [NASA ADS] [CrossRef] [Google Scholar]
- Hentunen, V. P., Nissinen, M., & Salmi, T. 2010, GCN #11373 [Google Scholar]
- Kalberla, P. M. W., Burton, W. B., Hartmann, D., et al. 2005, A&A, 440, 775 [NASA ADS] [CrossRef] [EDP Sciences] [Google Scholar]
- Klotz, A., Boër, M., Eysseric, J., et al. 2008, PASP, 120, 1298 [NASA ADS] [CrossRef] [Google Scholar]
- Kobayashi, S. 2000, ApJ, 545, 807 [NASA ADS] [CrossRef] [Google Scholar]
- Kruehler, T., Olivares, F., Nardini, M., & Greiner, J. 2010, GCN #11383 [Google Scholar]
- Laas-Bourez, M., Klotz, A., Coward, D., et al. 2010a, GCN #11380 [Google Scholar]
- Laas-Bourez, M., Klotz, A., Coward, D., et al. 2010b, GCN #11382 [Google Scholar]
- Lazzati, D., & Begelman, M. C. 2006, ApJ, 641, 972 [NASA ADS] [CrossRef] [Google Scholar]
- Lazzati, D., Rossi, E., Covino, S., Ghisellini, G., & Malesani, D. 2002, A&A, 396, L5 [NASA ADS] [CrossRef] [EDP Sciences] [Google Scholar]
- Liang, E. W., Lü, H. J., Hou, S. J., Zhang, B. B., & Zhang, B. 2009, ApJ, 707, 328 [NASA ADS] [CrossRef] [Google Scholar]
- McBreen, S., and the Fermi GBM team 2010, GCN #11378 [Google Scholar]
- Mészáros, P. 2006, Rep. Progress Phys., 69, 2259 [Google Scholar]
- Mészáros, P., & Rees, M. J. 1997, ApJ, 476, 232 [NASA ADS] [CrossRef] [Google Scholar]
- Nousek, J. A., Kouveliotou, C., Grupe, D., et al. 2006, ApJ, 642, 389 [NASA ADS] [CrossRef] [Google Scholar]
- Panaitescu, A., Mészáros, P., & Rees, M. J. 1998, ApJ, 503, 314 [NASA ADS] [CrossRef] [Google Scholar]
- Panaitescu, A., Mészáros, P., Burrows, D., et al. 2006, MNRAS, 369, 2059 [NASA ADS] [CrossRef] [Google Scholar]
- De Pasquale, M., Beardmore, A. P., Evans, P. A., et al. 2010, GCN #11370 [Google Scholar]
- Rees, M. J., & Mészáros, P. 1992, MNRAS, 258, 41 [NASA ADS] [CrossRef] [Google Scholar]
- Sari, R., & Piran, T. 1999, ApJ, 520, 641 [NASA ADS] [CrossRef] [Google Scholar]
- Sari, R., Piran, T., & Narayan, R. 1998, ApJ, 497, L17 [NASA ADS] [CrossRef] [Google Scholar]
- Stockdale, C. 2010, GCN #11422 [Google Scholar]
- Willingale, R., O’Brien, P. T., Osborne, J. P., et al. 2007, ApJ, 662, 1093 [NASA ADS] [CrossRef] [Google Scholar]
- Xin, L. P., Zheng, W. K., Wang, J., et al. 2010, MNRAS, 401, 2005 [NASA ADS] [CrossRef] [Google Scholar]
- Zhang, B. 2007, ChJAA, 7, 1 [Google Scholar]
All Tables
All Figures
|
Fig. 1 Light curve of GRB 101024A in optical (top panel) and X-ray (bottom panel). |
| In the text | |
|
Fig. 2 The X-ray best fit light curve (in black) compared to the optical data points (in red). See the electronic edition for colors. |
| In the text | |
Current usage metrics show cumulative count of Article Views (full-text article views including HTML views, PDF and ePub downloads, according to the available data) and Abstracts Views on Vision4Press platform.
Data correspond to usage on the plateform after 2015. The current usage metrics is available 48-96 hours after online publication and is updated daily on week days.
Initial download of the metrics may take a while.