Fig. 3
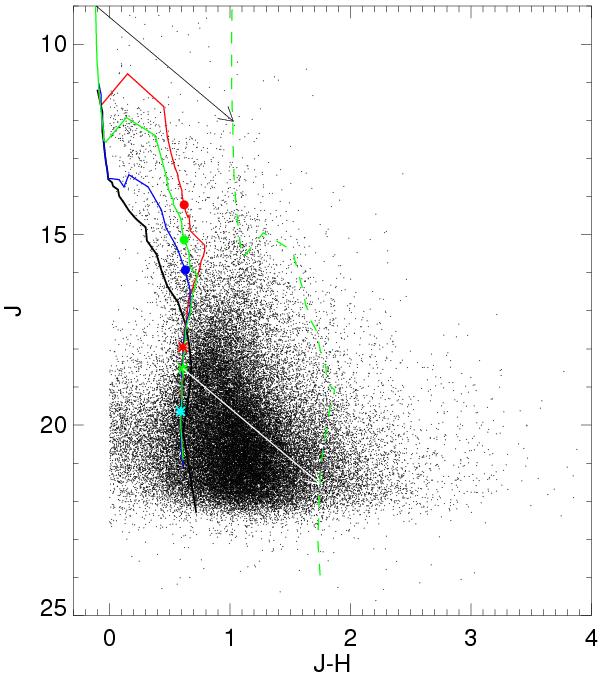
Color − magnitude diagram of all HAWK-I sources with NIR excesses. The solid lines show isochrones for ages of 1 Myr (red), 3 Myr (green), 10 Myr (blue), and the ZAMS composed from the models of Baraffe et al. (1998) for the mass range 0.02 to 0.5 M⊙ and Siess et al. (2000) for the mass range 0.5 to 7 M⊙. The large solid dots mark the positions of 1 M⊙ stars, the asterisks those of 0.075 M⊙ objects on the 1, 3, and 10 Myr isochrones. The arrows indicate reddening vectors for AV = 10 mag and were computed for an extinction law with RV = 4 (see Povich et al. 2011b). The dashed green line shows the 3 Myr isochrone reddened by that amount. Note that all bright objects with J < 12.5 are in the saturation/non-linearity regime of the HAWK-I data and their photometry is therefore unreliable.
Current usage metrics show cumulative count of Article Views (full-text article views including HTML views, PDF and ePub downloads, according to the available data) and Abstracts Views on Vision4Press platform.
Data correspond to usage on the plateform after 2015. The current usage metrics is available 48-96 hours after online publication and is updated daily on week days.
Initial download of the metrics may take a while.