Free Access
Fig. 4
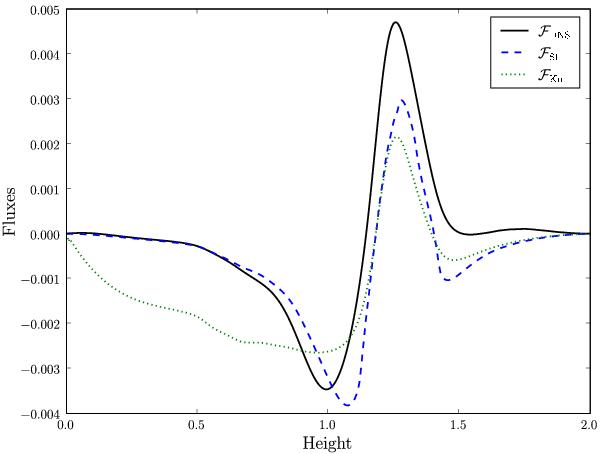
Mean convective flux in the DNS (solid black line), compared with the best TDC predictions based on the optimal α values that came out of the χ2-test in Sect. 3.3 (Stellingwerf’s model is a dashed blue line and Kuhfuß’s a dotted green line).
Current usage metrics show cumulative count of Article Views (full-text article views including HTML views, PDF and ePub downloads, according to the available data) and Abstracts Views on Vision4Press platform.
Data correspond to usage on the plateform after 2015. The current usage metrics is available 48-96 hours after online publication and is updated daily on week days.
Initial download of the metrics may take a while.