Free Access
Fig. 1
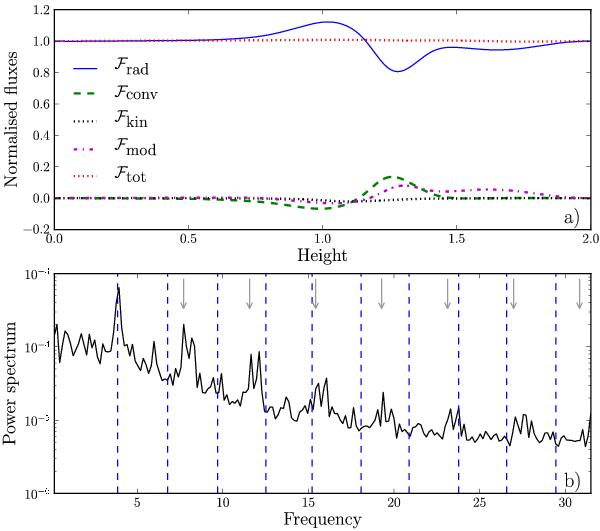
a) Mean vertical profiles of radiative ℱrad (solid blue line), turbulent enthalpy ℱconv (dashed green line), kinetic ℱkin (dotted black line), modes ℱmod (dot-dashed magenta line), and total ℱtot (dotted red line) fluxes, normalised to the bottom flux Fbot. b) Temporal power spectrum for the convective flux alone.
Current usage metrics show cumulative count of Article Views (full-text article views including HTML views, PDF and ePub downloads, according to the available data) and Abstracts Views on Vision4Press platform.
Data correspond to usage on the plateform after 2015. The current usage metrics is available 48-96 hours after online publication and is updated daily on week days.
Initial download of the metrics may take a while.