Fig. 3
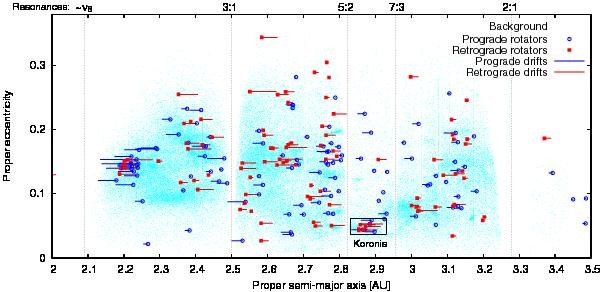
Relation between the proper semi-major axis and the proper eccentricity for asteroids in our sample and for the first 100 000 numbered asteroids for comparison. Main resonances are shown by dotted lines. Prograde rotators are plotted with blue circles and retrograde rotators with red squares. The horizontal lines represent for each asteroid its estimated past drift (i.e. where the asteroid came from) during the collisional lifetime computed with Eq. (7). Proper elements are from the AstDyS database.
Current usage metrics show cumulative count of Article Views (full-text article views including HTML views, PDF and ePub downloads, according to the available data) and Abstracts Views on Vision4Press platform.
Data correspond to usage on the plateform after 2015. The current usage metrics is available 48-96 hours after online publication and is updated daily on week days.
Initial download of the metrics may take a while.