Fig. 1
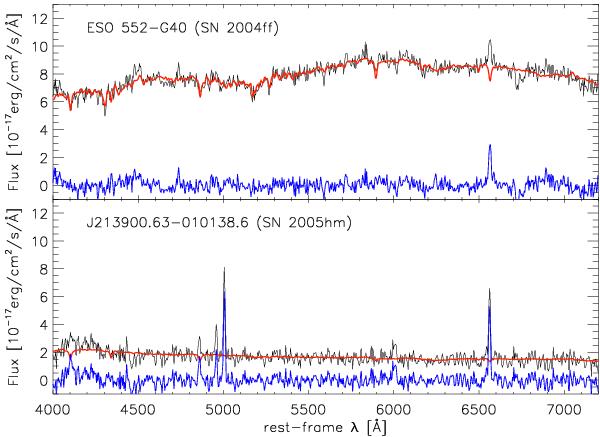
Examples of stellar continuum fit and extraction of emission line spectrum for two representative cases. The black line shows the original spectrum at the location of the SN explosion. This spectrum is fit with a linear combination of SSP models with dust attenuation as an additional free parameter: the resulting best fit of the stellar continuum is shown in red. By subtracting the best-fit continuum from the original spectrum we obtain the pure emission line spectrum (blue line).
Current usage metrics show cumulative count of Article Views (full-text article views including HTML views, PDF and ePub downloads, according to the available data) and Abstracts Views on Vision4Press platform.
Data correspond to usage on the plateform after 2015. The current usage metrics is available 48-96 hours after online publication and is updated daily on week days.
Initial download of the metrics may take a while.