Fig. 7
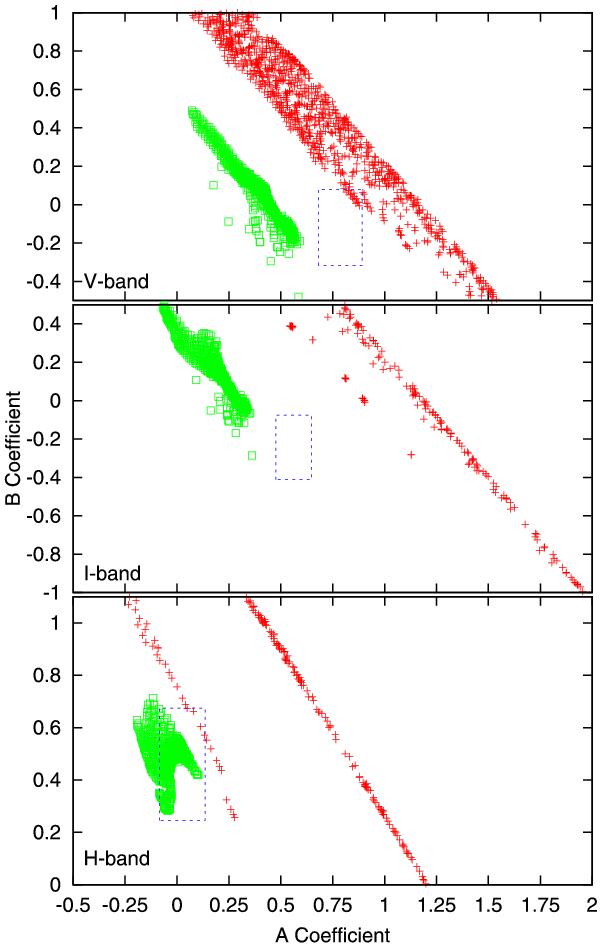
Red plus symbols represent the limb-darkening coefficients A and B computed from SAtlas model intensity profiles for the V, I, and H-bands, and green open squares represent the coefficients computed with plane-parallel Atlas models. The box in each plot shows the range of the coefficients derived from microlensing observations by Fields et al. (2003).
Current usage metrics show cumulative count of Article Views (full-text article views including HTML views, PDF and ePub downloads, according to the available data) and Abstracts Views on Vision4Press platform.
Data correspond to usage on the plateform after 2015. The current usage metrics is available 48-96 hours after online publication and is updated daily on week days.
Initial download of the metrics may take a while.