Fig. 8
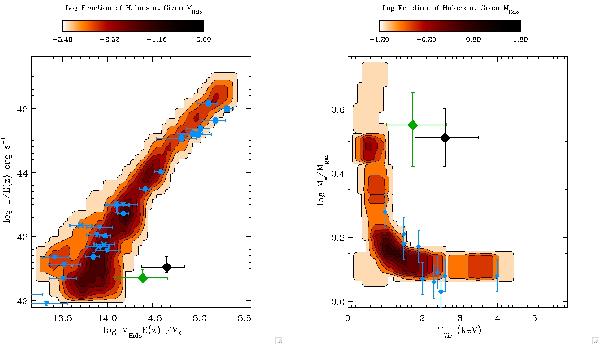
Left: the fraction of clusters as a function of mass and X-ray luminosity in the semianalytic model (colour coded contours), along with the position of cluster ClG 0332-2747 in the M − LX plane: the black filled square is derived from the full galaxy sample, the green one from red-sequence members only (see main body for details). Blue symbols and error bars are the clusters from the literature represented in Fig. 6. Right: the fraction of clusters as a function of virial temperature and Mstar/Mgas ratio in the semianalytic model (colour-coded contours), along with the relevant quantities for cluster ClG 0332-2747 (black and green squares) and for the clusters in the sample by Dai et al. (2010) (blue).
Current usage metrics show cumulative count of Article Views (full-text article views including HTML views, PDF and ePub downloads, according to the available data) and Abstracts Views on Vision4Press platform.
Data correspond to usage on the plateform after 2015. The current usage metrics is available 48-96 hours after online publication and is updated daily on week days.
Initial download of the metrics may take a while.