Fig. 2
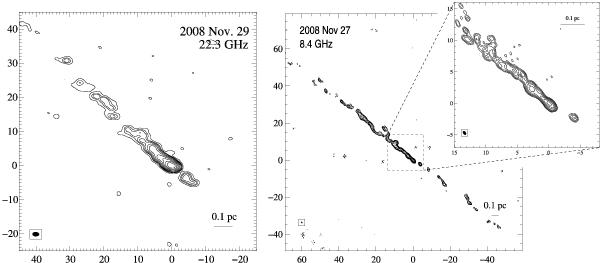
22.3 GHz and 8.4 GHz images of Cen A from 2008 November 27 and 29, using natural weighting. The inset shows the inner region of Cen A at 8.4 GHz using uniform weighting. The lowest contours denote the 3σ-noise-level (see Table 1). All axes are in units of mas relative to the phase center. The ellipse in the lower left corner of each panel indicates the restoring beam.
Current usage metrics show cumulative count of Article Views (full-text article views including HTML views, PDF and ePub downloads, according to the available data) and Abstracts Views on Vision4Press platform.
Data correspond to usage on the plateform after 2015. The current usage metrics is available 48-96 hours after online publication and is updated daily on week days.
Initial download of the metrics may take a while.