Fig. 3
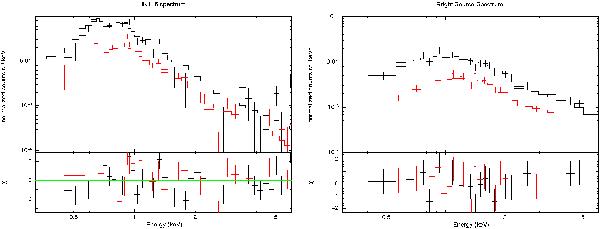
EPIC spectra from IKT 16 (left) and the bright source located near its centre (right). In both cases the solid line corresponds to the best-fit spectral model (see text and Table 3), with the upper line showing the combined spectra from pn observations and the lower line combined spectra from MOS1 and MOS2 observations. The χ2 residuals with respect to the best-fitting model are also shown.
Current usage metrics show cumulative count of Article Views (full-text article views including HTML views, PDF and ePub downloads, according to the available data) and Abstracts Views on Vision4Press platform.
Data correspond to usage on the plateform after 2015. The current usage metrics is available 48-96 hours after online publication and is updated daily on week days.
Initial download of the metrics may take a while.