Fig. 1
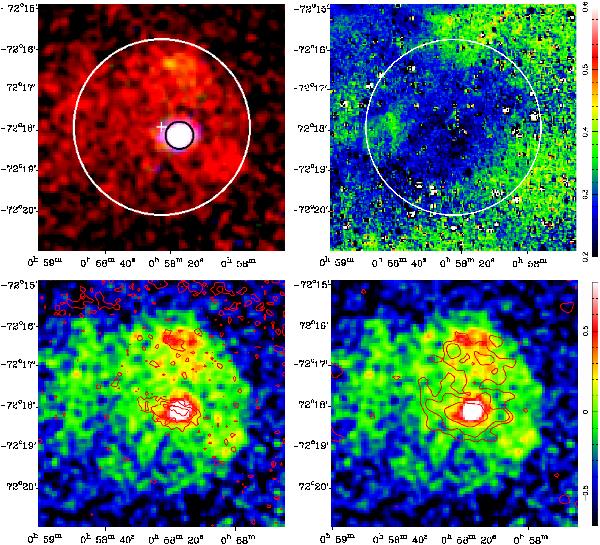
Top left: lightly smoothed RGB XMM-Newton EPIC image of IKT 16 (R = 0.3−0.8 keV, G = 0.8−1.2 keV, B = 1.2−2.0 keV). The two regions marked are those used for spectral analysis for the SNR (white circle) and the bright source (black circle). The centre of the remnant is marked with a cross. The image is binned in 4′′ × 4′′ pixels, and is displayed logarithmically with a dynamic range of 20. Top right: MCELS [S ii]/Hα ratio of IKT 16. The image is binned in 2′′ × 2′′ pixels. The white circle indicates the extent of the SNR. Bottom left: lightly smoothed soft X-ray image (0.3−1 keV) overlaid with high-resolution 20 cm (1400 MHz) ATCA radio contours. The contours are at levels of 0.07, 0.14 and 0.28 mJy beam-1. The X-ray image is displayed logarithmically with a dynamic range of 20, and the X-ray colour bar is shown in units of log(pn+MOS) ct/pixel/20 ks. Bottom right: soft X-ray map overlaid with 3 cm (8640 MHz) ATCA radio contours. The contours are at levels of 0.25, 0.5 and 1.0 mJy beam-1. The beam sizes for the radio observations are shown in Table 2.

Current usage metrics show cumulative count of Article Views (full-text article views including HTML views, PDF and ePub downloads, according to the available data) and Abstracts Views on Vision4Press platform.
Data correspond to usage on the plateform after 2015. The current usage metrics is available 48-96 hours after online publication and is updated daily on week days.
Initial download of the metrics may take a while.