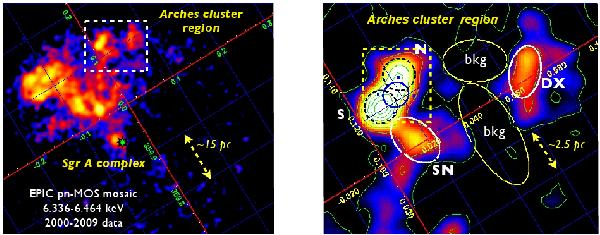
Fig. 1

Leftpanel: Fe-Kα emission line map of the GC region. The data have been background subtracted and vignetting corrected. The position of Sgr A* is marked by a green star. The dashed white ellipse shows the AC region. Rightpanel: a zoom into the AC region. The position of the AC is indicated by the blue ellipse at l ~ 0.12°, b ~ 0.02°. Bright 6.4-keV knots are highlighted by dashed black circles (labelled N and S) and white ellipses (labelled SN at b ~ 0.015° and DX at b ~ 0.07°). The region used for background accumulation is shown by the two yellow ellipses (bkg). The dashed yellow box shows the sky region studied in Wang et al. (2006, Fig. 14). The galactic coordinate grid is shown in red.
Current usage metrics show cumulative count of Article Views (full-text article views including HTML views, PDF and ePub downloads, according to the available data) and Abstracts Views on Vision4Press platform.
Data correspond to usage on the plateform after 2015. The current usage metrics is available 48-96 hours after online publication and is updated daily on week days.
Initial download of the metrics may take a while.


