Free Access
Fig. 8
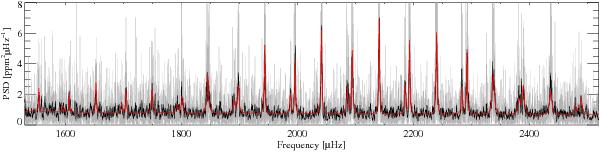
Power spectral density of HD 52265 in the p-mode frequency range at full resolution (grey curve) and smoothed by a 11-bin wide boxcar (black curve). The red line corresponds to the fitted spectrum.
Current usage metrics show cumulative count of Article Views (full-text article views including HTML views, PDF and ePub downloads, according to the available data) and Abstracts Views on Vision4Press platform.
Data correspond to usage on the plateform after 2015. The current usage metrics is available 48-96 hours after online publication and is updated daily on week days.
Initial download of the metrics may take a while.