Fig. 7
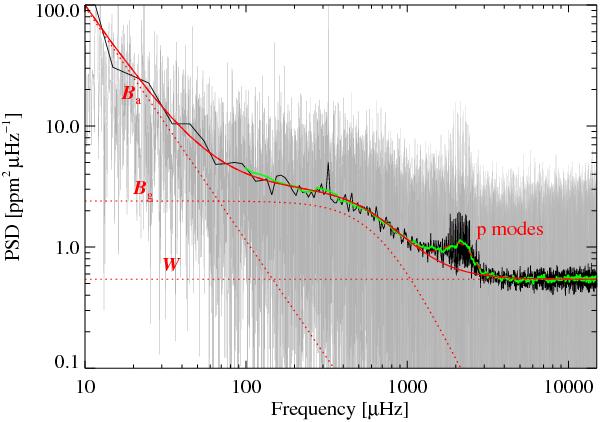
Power spectral density of HD 52265 at full resolution (grey curve) and rebinned with a factor of 100 (black curve). The green line shows the spectrum smoothed by a box car with a width equal to the mean large separation  . The fitted background is the solid red line, and its three components (W, Bg, Ba, see text) are plotted as red dotted lines. P-mode power excess, fitted as a Gaussian profile, is also represented with a red dashed line.
Current usage metrics show cumulative count of Article Views (full-text article views including HTML views, PDF and ePub downloads, according to the available data) and Abstracts Views on Vision4Press platform.
Data correspond to usage on the plateform after 2015. The current usage metrics is available 48-96 hours after online publication and is updated daily on week days.
Initial download of the metrics may take a while.