Free Access
Fig. 5
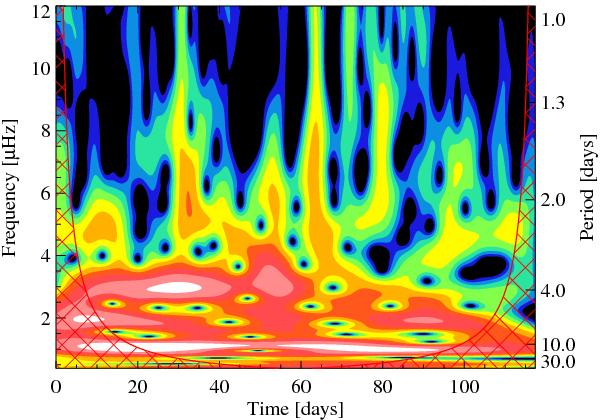
Wavelet power spectrum for HD 52265 as a function of the frequency of the Morlet wavelet (y-axis) and time (x-axis). The colour scale is logarithmic, white corresponds to the highest values, and red hatching indicates the cone of influence delimiting the reliable periodicity.
Current usage metrics show cumulative count of Article Views (full-text article views including HTML views, PDF and ePub downloads, according to the available data) and Abstracts Views on Vision4Press platform.
Data correspond to usage on the plateform after 2015. The current usage metrics is available 48-96 hours after online publication and is updated daily on week days.
Initial download of the metrics may take a while.