Fig. 14
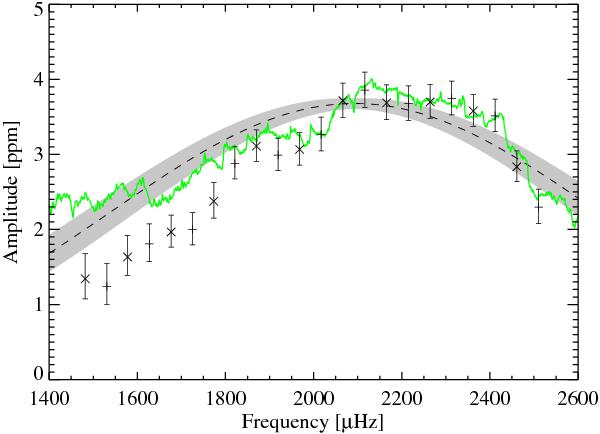
Amplitudes of radial modes as a function of frequency for HD 52265. Crosses correspond to values obtained by fitting the same intrinsic amplitudes for modes (l = 1, n − 1) and (l = 0, n), i.e. fit A, whereas plus signs correspond to values obtained by fitting same intrinsic amplitudes for modes (l = 1, n) and (l = 0, n), i.e. fit B. Amplitudes are plotted as a function of the mean frequency of the two modes. The dashed line shows the amplitudes of radial modes deduced from the fit as a Gaussian profile of the p-mode power excess (see Sect. 5). Grey area indicates the associated 1-σ error bars. The green curve shows the amplitudes of radial modes deduced from the spectrum smoothed by a  -wide boxcar, after subtracting the background.
Current usage metrics show cumulative count of Article Views (full-text article views including HTML views, PDF and ePub downloads, according to the available data) and Abstracts Views on Vision4Press platform.
Data correspond to usage on the plateform after 2015. The current usage metrics is available 48-96 hours after online publication and is updated daily on week days.
Initial download of the metrics may take a while.