Fig. 13
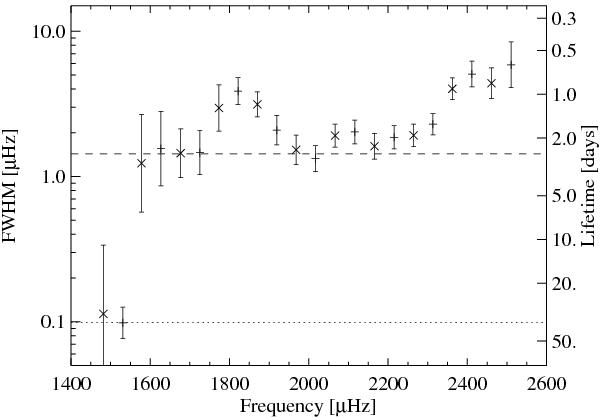
Full width at half maximum of modes as a function of frequency for HD 52265. Crosses correspond to values obtained by fitting the same widths for modes (l = 1, n − 1) and (l = 0, n), i.e. fit A, whereas plus signs correspond to values obtained by fitting the same widths for modes (l = 1, n) and (l = 0, n), i.e. fit B. Widths are plotted as a function of the mean frequency of the two modes. The dotted line indicates the spectral resolution. The dashed line shows predictions by Chaplin et al. (2009). The y-axis on the right-hand side shows the corresponding lifetimes.
Current usage metrics show cumulative count of Article Views (full-text article views including HTML views, PDF and ePub downloads, according to the available data) and Abstracts Views on Vision4Press platform.
Data correspond to usage on the plateform after 2015. The current usage metrics is available 48-96 hours after online publication and is updated daily on week days.
Initial download of the metrics may take a while.