Fig. 10
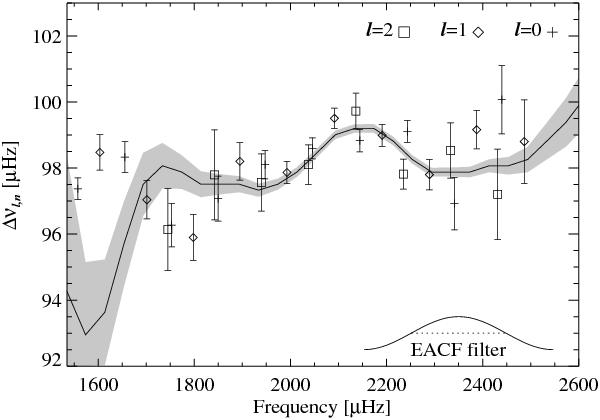
Large separations Δνl, n = νl, n − νl, n − 1 for l = 0, 1, and 2 modes plotted as a function of the frequency (νl, n + νl, n − 1)/2 for HD 52265 (symbols with error bars). A solid line shows the variations in Δν obtained with the envelope autocorrelation function. The grey area indicates 1-σ error bars. The inset shows the cosine filter with a full width at half maximum equal to 2 times the mean large separation used for computing the EACF.
Current usage metrics show cumulative count of Article Views (full-text article views including HTML views, PDF and ePub downloads, according to the available data) and Abstracts Views on Vision4Press platform.
Data correspond to usage on the plateform after 2015. The current usage metrics is available 48-96 hours after online publication and is updated daily on week days.
Initial download of the metrics may take a while.